29
The Effect of Alcohol on Prokaryotic Survivorship Luke Nedrow 9 th Grade Central Catholic High School
| Date post: | 28-Dec-2015 |
| Category: |
Documents |
| Upload: | meryl-pearson |
| View: | 220 times |
| Download: | 2 times |

The Effect of Alcohol on Prokaryotic Survivorship
Luke Nedrow9th GradeCentral Catholic High School

Chemistry of Alcohol
Alcohol -the hydroxyl functional group is bound to a saturated carbon atom.
Ethanol – 1.Very common alcohol 2.Very toxic substance 3.Two main metabolites,
acetaldehyde and acetic acid.

Alcohol Statistics
Alcoholic beverages are one of America’s favorite drinks.
57% of American adults over the age 18 said they consumed alcohol in the past month.
88 thousand people die annually from drinking related issues.
223.5 billion dollars are spent in the USA alone on alcohol misuse problems.

The 3 Types of Alcohol
Most Dangerous Second Most Dangerous
Least Dangerous
Takes a long time to digest and byproducts are very dangerous
Most are ethanol based-Byproducts are dangerous if consumed in large quantities
Tertiary and Secondary Alcohols
Vodka, Moonshine, Methanol (Wood alcohol)
Some beers and most wines
Quickly digested- Most Beers

Variables (Beer, Liquor, Wine)
The variables for this experiment were beer, liquor, and wine.
Beer-Coors Light Alcohol Level- 4.2%
Wine- Sutter Home Sauvignon Blanc Alcohol Level – 12.5%
Liquor- Smirnoff Vodka Alcohol Level- 37.5%
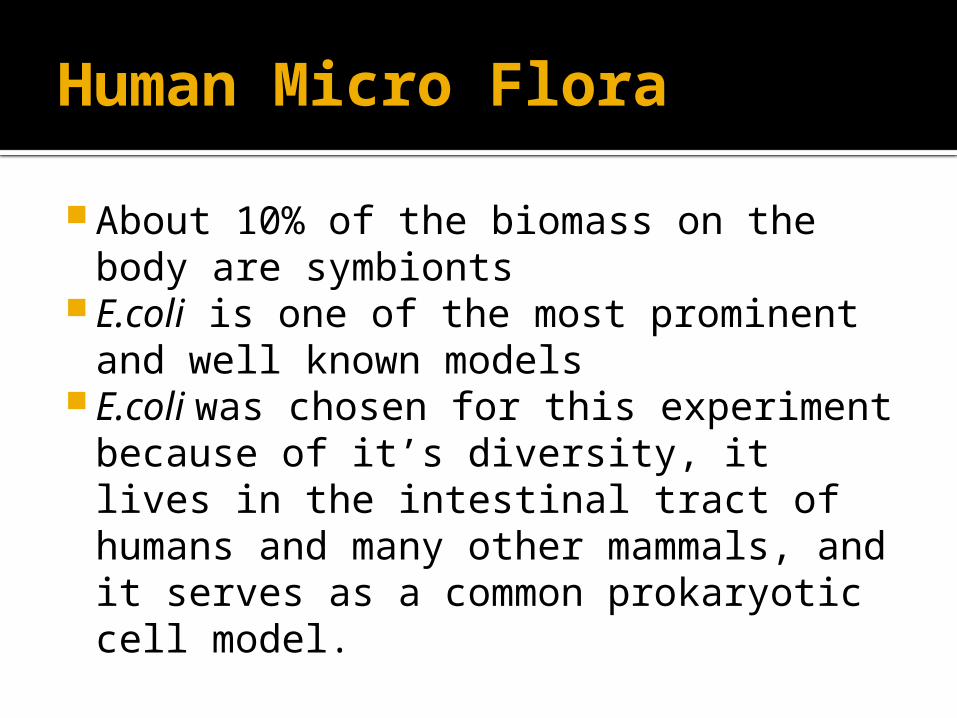
Human Micro Flora
About 10% of the biomass on the body are symbionts
E.coli is one of the most prominent and well known models
E.coli was chosen for this experiment because of it’s diversity, it lives in the intestinal tract of humans and many other mammals, and it serves as a common prokaryotic cell model.
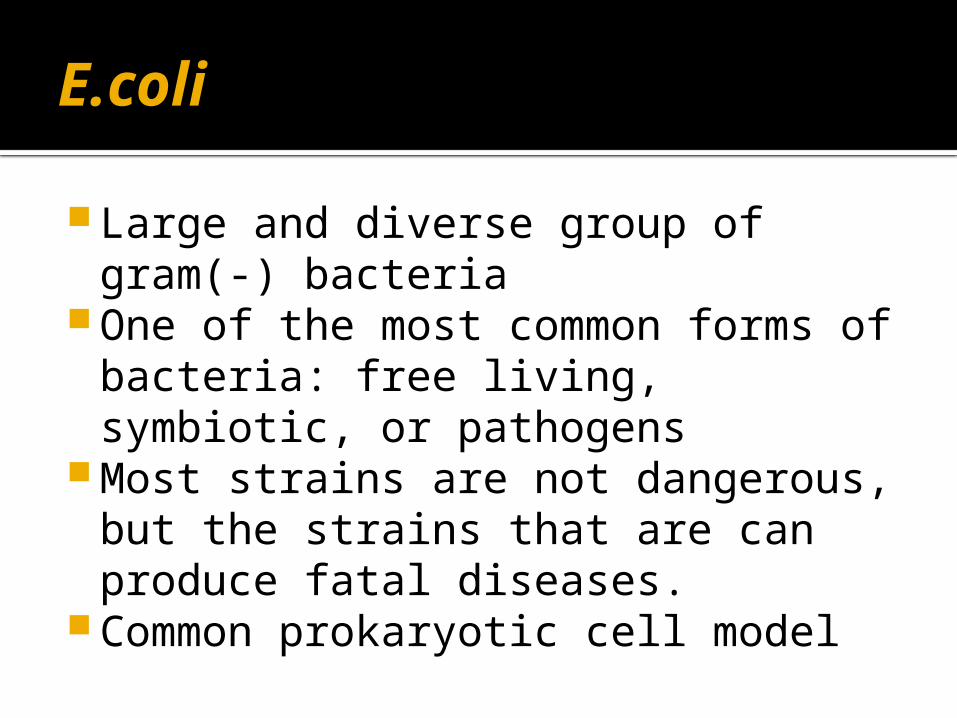
E.coli
Large and diverse group of gram(-) bacteria
One of the most common forms of bacteria: free living, symbiotic, or pathogens
Most strains are not dangerous, but the strains that are can produce fatal diseases.
Common prokaryotic cell model

Rationale
The human micro flora performs many functions vital to human health.
Close to 60% of the legal population drink alcohol on a monthly basis.
Does alcohol effect the micro flora in the digestive system?
Which type of alcohol effects the microflora the most?

Hypothesis
Null- The alcohol will have no significant effect on E.coli survivorship.
Alternate- The liquor (Smirnoff Vodka) will have the most significant effect on E.coli survivorship.

Materials Coors Light Smirnoff Vodka Sutter Home
Sauvignon Blanc LB agar plates (1%
tryptone, .5% yeast extract, 1%NaCl)
E.coli Spreader plates Open flame and
ethanol (for disinfecting spreader bars)
Various sized pipettes
Sterile Fluid Test tubes Test tube rack Heat plate/stirrer Vortex Incubator Bunsen Burner

Procedure
1.Bacteria (E.coli) were grown overnight in sterile LB media.
2. Samples of the overnight cultures were added to fresh media in a sterile sidearm flask.
3. The cultures were placed in an incubator (37˚C) until a density of 50 Klett spectrophotometer units was reached. This represents a cell density of approximately 10^8 cells/mL.
4. The cultures were diluted in sterile fluid to a concentration of approximately 10^5 cells/mL.

Procedure ( Liquid Pulse)
1.LB agar plates(1% tryptone, .5% yeast extract, 1%NaCl) were prepared
2. Alcohol was pipetted into tubes containing SDF, to create the following concentrations: 0%, 1%, 10%, and 50%, yielding a final volume of 10 mL.
3.The cells were vortexed for even suspension.

Concentration Chart
Control (0%)
1% 10% 50%
Variable (Type of Alcohol)
0 mL .1 mL 1 mL 5 mL
Sterile Fluid 9.9 mL 9.8 mL 8.9 mL 4.9 mL
E.coli .1 mL .1 mL .1 mL .1 mL
Final 10 mL 10 mL 10 mL 10 mL

Procedure (Cont.)
4. Removed test tubes from test tube rack and 0.1mL was pipetted into each plate.
5. Plates were incubated at 37°C overnight. The resulting colonies were counted.
Each colony is assumed to have risen from one cell.

Smirnoff Vodka Effects on E.Coli Survivorship
0% 1% 10% 50%0
100
200
300
400
500
600
700
P-Value =3.47 ^-05
Amount of Surviving Cells
Smirnoff Vodka Concentrations

Coors Light Effects on E.Coli Survivorship
0% 1% 10% 50%0
100
200
300
400
500
600
700
800
P- Value =2.45 ^ -08
Amount of Surviving Cells
Coors Light Concentrations

Sauvignon Blanc Effects on E.Coli Survivorship
0% 1% 10% 50%0
100
200
300
400
500
600
700
P-Value= 1.06 ^-10
Amount of Surviving Cells
Sauvignon Blanc Concentrations

Dunnett’s Test
Replicates
Avg. of Group – Avg. of Control
(2) (MS Within Group)
A Dunnett’s quantifies significant change in data between the control and experimental groups.
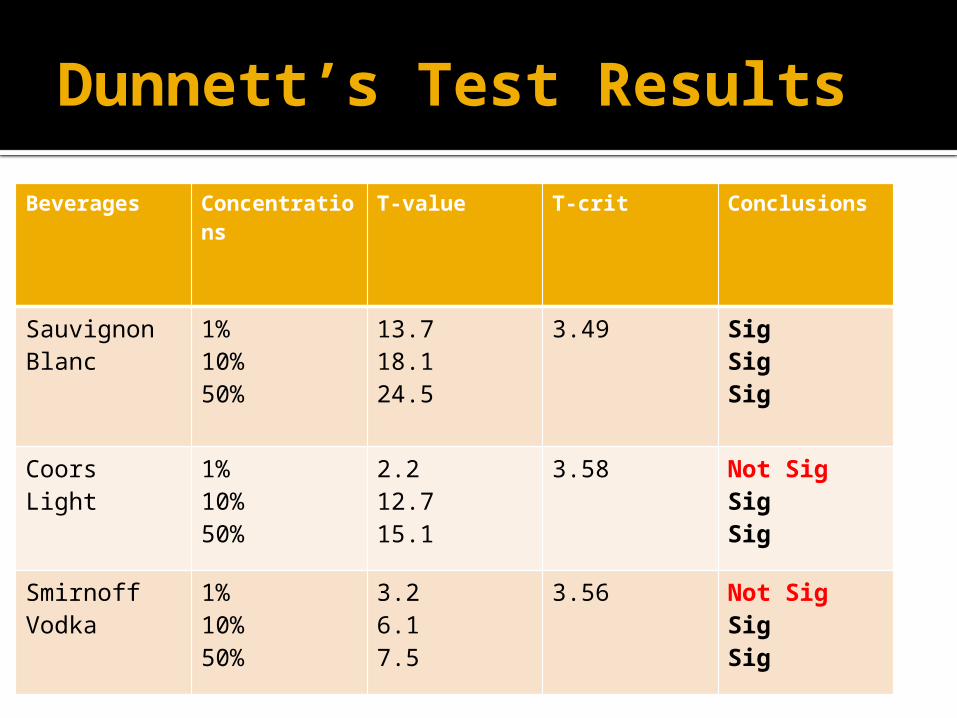
Dunnett’s Test Results
Beverages Concentrations
T-value T-crit Conclusions
Sauvignon Blanc
1%10%50%
13.718.124.5
3.49 SigSigSig
Coors Light 1%10%50%
2.212.715.1
3.58 Not SigSig Sig
Smirnoff Vodka
1%10%50%
3.26.17.5
3.56 Not SigSigSig

Conclusions
Reject Null Hypothesis for all the exposures except:
1% Coors Light 1% Smirnoff Accept Alternative Hypothesis for all
other trials except for the aforementioned
The alcohol appeared to have a negative effect on E.coli survivorship.

Limitations and Extensions
Only tested one type of microbe Only one exposure time Possible contamination from spread-
plating Only three concentrations of alcohol Only thee alcoholic drinks Only survivorship quantified, not
growth

References
“E. Coli Food Poisoning.” About. About E. Coli, n.d Web. < http://www.about-ecoli.com/>
Melton, Lisa. “Alcohol.” Wikipedia, Web. http://en.m.wikipedia.org/wiki/Alcohol.
Special Thanks to Mr. Krotec

Percent Survivorship of E.Coli when exposed to alcohol
1% 10% 50%0%
10%
20%
30%
40%
50%
60%
70%
80%
90%
100%
Smirnoff VodkaCoors LightSauvignon Blanc
Percent Survivorship
Concentrations

Smirnoff Results (All)
0% 566 438 486 422
1% 370 424 378 296
10% 224 304 286 258
50% 192 194 202 206
Surviving Colonies

Coors Light (All)
0% 872 828 582 (Outlier)
738
1% 686 804 744 676
10% 394 318 346 322
50% 212 204 246 238
Surviving Colonies

Wine Results (All)
0% 606 654 618 722
1% 360 371 313 362
10% 264 268 258 240
50% 102 112 134 126
Surviving Colonies
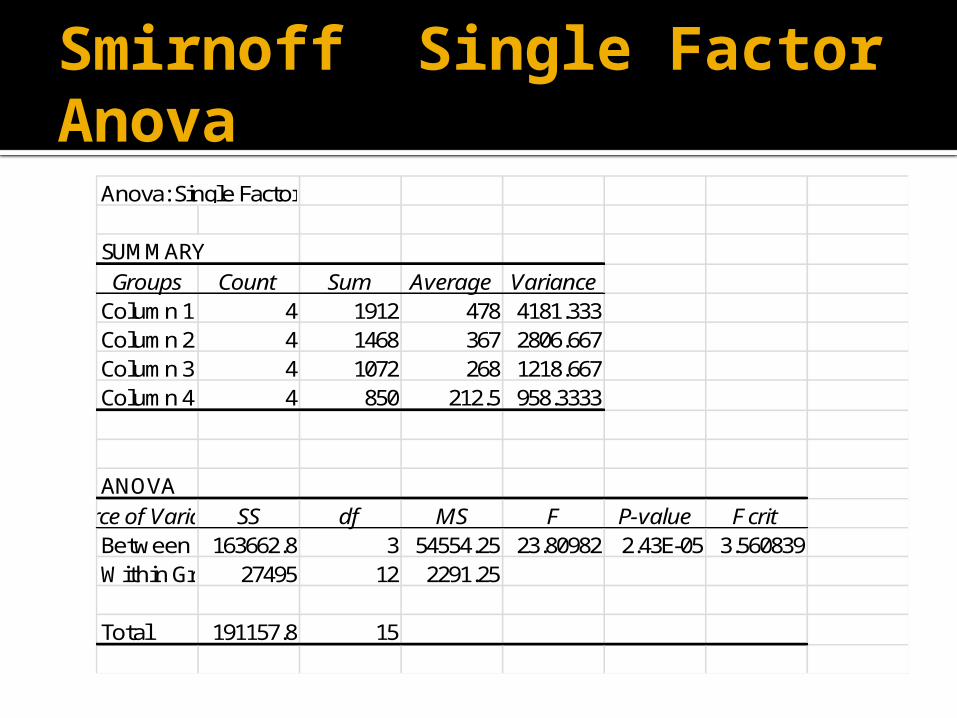
Smirnoff Single Factor Anova
Anova: Single Factor
SUMMARYGroups Count Sum Average Variance
Column 1 4 1912 478 4181.333Column 2 4 1468 367 2806.667Column 3 4 1072 268 1218.667Column 4 4 850 212.5 958.3333
ANOVASource of VariationSS df MS F P-value F crit
Between Groups163662.8 3 54554.25 23.80982 2.43E-05 3.560839Within Groups27495 12 2291.25
Total 191157.8 15

Coors Light Single Factor Anova
Anova: Single Factor
SUMMARYGroups Count Sum Average Variance
Column 1 4 3248 812 23369Column 2 4 2910 727.5 3499.667Column 3 4 1380 345 1220Column 4 4 900 225 406.6667
ANOVASource of VariationSS df MS F P-value F crit
Between Groups837393 3 279131 39.1827 1.78E-06 3.580803Within Groups85486 12 7123.833
Total 922879 15

Wine Single Factor AnovaAnova: Single Factor
SUMMARYGroups Count Sum Average Variance
Column 1 4 2600 650 2720Column 2 4 1406 351.5 681.6667Column 3 4 1030 257.5 153Column 4 4 474 118.5 203.6667
ANOVASource of VariationSS df MS F P-value F crit
Between Groups608096.8 3 202698.9 215.7328 1.06E-10 3.490295Within Groups11275 12 939.5833
Total 619371.8 15


