27
Monitoring for Benzene at Refinery Fencelines 10 Oil Refineries Across U.S. Emitted Cancer-Causing Benzene Above EPA Action Level FEBRUARY 6, 2020

Monitoring for Benzene at Refinery Fencelines
10 Oil Refineries Across U.S. Emitted Cancer-Causing Benzene Above EPA Action Level
FEBRUARY 6, 2020

ACKNOWLEDGEMENTS
This report was written by Benjamin Kunstman and Eric Schaeffer, with analysis by Keene Kelderman, Vincent Bregman, Abel Russ, and Alexandra Shaykevich of the Environmental Integrity Project.
THE ENVIRONMENTAL INTEGRITY PROJECT
The Environmental Integrity Project (http://www.environmentalintegrity.org) is a nonpartisan, nonprofit organization established in March of 2002 by former EPA enforcement attorneys to advocate for effective enforcement of environmental laws. EIP has three goals: 1) to provide objective analyses of how the failure to enforce or implement environmental laws increases pollution and affects public health; 2) to hold federal and state agencies, as well as individual corporations, accountable for failing to enforce or comply with environmental laws; and 3) to help local communities obtain the protection of environmental laws.
For questions about this report, please contact EIP Director of Communications Tom Pelton at (202) 888-2703 or [email protected].
PHOTO CREDITS:
Cover image: the Navajo refinery in Artesia, NM, The Center for Land Use Interpretation (https://clui.org/ludb/site/navajo-refinery).

3
Monitoring for Benzene at Refinery Fencelines Executive Summary
efineries across the U.S. release hazardous air pollutants that can increase health risks to those living nearby, by contributing to higher cancer rates, respiratory diseases, developmental delays in infants and even, at high doses, premature death. The Environmental Integrity Project and Earthjustice filed a lawsuit against the
U.S. Environmental Protection Agency in 2012 on behalf of seven community and environmental groups to force the agency to adopt stricter standards to protect people living closest to the fencelines of refineries. Often these working-class neighborhoods have high proportions of African-American and Hispanic households.
In response, EPA adopted Clean Air Act regulations in 2015, which became effective in February 2016. These rules include a requirement that beginning in January 2018, refineries measure the average benzene concentration1 at locations around the perimeter of the plants using a network of monitors. If the net benzene level at any of the monitoring location exceeds an average of 9 micrograms per cubic meter of air over a one-year period,2 the EPA regulations require the facility to conduct a root cause analysis to determine the source of the toxic emissions and to then take action to fix the problem and lower the concentrations. After the first full year of the program, EIP examined the monitoring reports for more than 100 refineries across the U.S., which are publicly available on EPA’s website.3 As of the third quarter of 2019 (which ended on September 30, 2019), fenceline benzene levels at 10 refineries exceeded the EPA “action level,” shown in Table 1 below.
Table 1. Refineries with Fenceline Monitored Benzene Levels above EPA Action Level4
Facility City State Net Concentration (micrograms per
cubic meter)
% Greater than EPA Action
Level
Philadelphia Energy Solutions Philadelphia PA 49.0 444% HollyFrontier Navajo Artesia Artesia NM 36.0 300% Total Port Arthur Refinery Port Arthur TX 22.3 148% Pasadena Refining Pasadena TX 18.0 100% Flint Hills Resources Corpus Christi East Corpus Christi TX 16.1 79% Chevron Pascagoula Pascagoula MS 13.8 53% Valero Corpus Christi East Corpus Christi TX 13 44% Chalmette Refining Chalmette LA 12.3 37% Shell Deer Park Deer Park TX 11.1 23% Marathon Galveston Bay Texas City Texas City TX 10 11%
The EPA action level is 9 micrograms per cubic meter of air. Numbers above reflect refinery annual average net benzene concentrations at the fenceline in micrograms per cubic meter of air for the year ending on September 30, 2019.
The actual exposure to benzene in nearby communities can vary from the concentrations measured at a refinery’s fenceline, depending on multiple factors that include emissions
R

4
from nearby non-refinery sources (which may include motor vehicles and chemical plants), weather conditions and wind direction. However, long-term exposure to the levels of pollution seen in Table 1 can cause adverse health effects, including impacts to the blood and nervous systems, and an increased risk of cancer (hematologic leukemia).
EPA’s Integrated Risk Information System indicates that inhaling benzene concentrations as low as 13 micrograms per cubic meter over a lifetime is likely to cause one additional cancer case for every 10,000 people exposed. 5 Based on those estimates, communities that face long-term exposure to the benzene levels reported in Table 1 could see as many as four additional cancers per 10,000 people exposed.
The California Office of Environmental Health Hazard Assessment developed a chronic inhalation reference exposure level for benzene of 3 micrograms per cubic meter. This represents the concentration at or below which adverse non-cancer health effects would not be expected from continuous chronic exposure.6 Exposure to levels above the reference exposure level may increase the risk of health problems such as decreased white blood cell count and increased risk of blood disorders and disease. All 10 refineries shown in Table 1 have annual average fenceline benzene concentrations that are more than three times higher than California’s chronic reference exposure level.
State and federal agencies have also developed benzene concentration levels designed to protect people from short-term, or acute, exposure to benzene, which can result in both developmental delays in young children and harm to the blood system.7 The U.S. Department of Health and Human Services’ Agency for Toxic Substances and Disease Registry developed a minimal risk level for acute inhalation exposure to benzene of 9 parts per billion (approximately equivalent to 30 micrograms per cubic meter).8 Table 2 shows refineries with individual 14-day net sampling concentrations that exceeded this federal acute risk level for inhalation of benzene.
Table 2. Refinery Fenceline Benzene above Federal Acute Minimal Risk Level
Facility Name State Max 2-week Net
Concentration (micrograms per cubic meter)
# of Periods above Acute Risk
Level HollyFrontier Navajo Artesia NM 998 25 Philadelphia Energy Solutions PA 189 16 Pasadena Refining TX 189 3 Total Port Arthur Refinery TX 142 9 Chevron Pascagoula MS 140 2 Chalmette Refining LA 97 4 Lima Refining Company OH 81 1 Shell Deer Park TX 81 3 Valero Corpus Christi East TX 78 5 Phillips 66 Wood River Docks IL 57 2 Placid Refining Port Allen LA 57 1 Valero Corpus Christi West TX 54 2
5
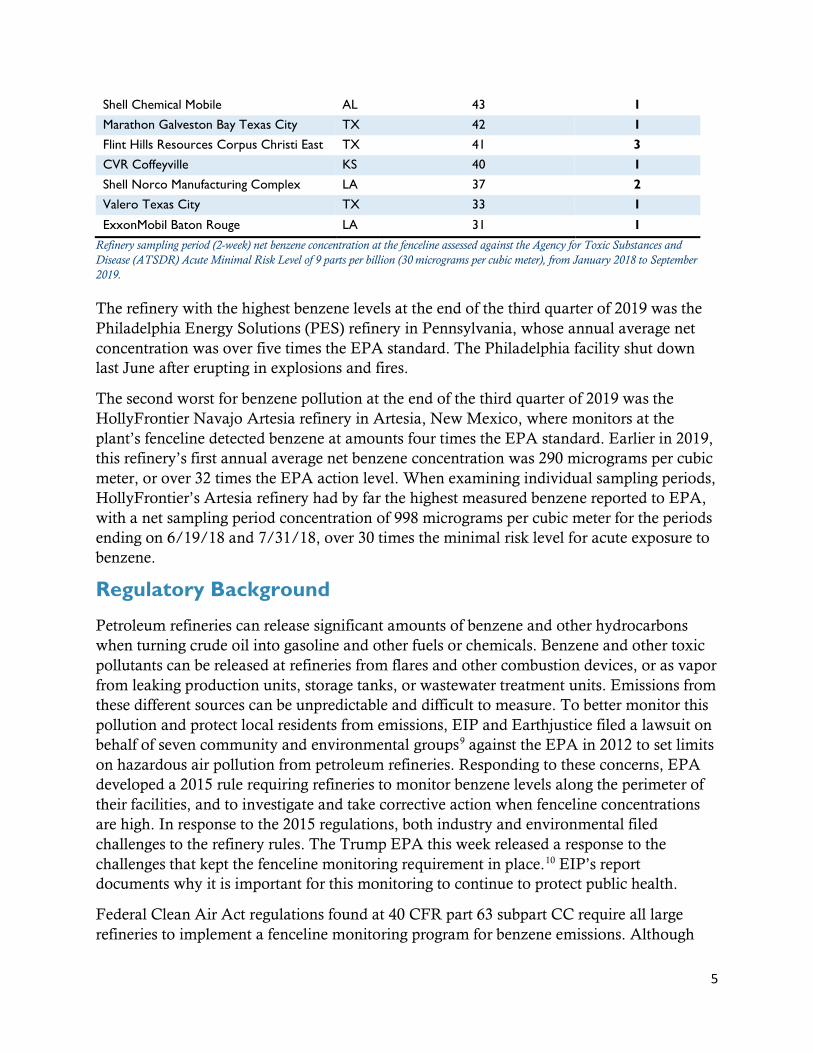
Shell Chemical Mobile AL 43 1 Marathon Galveston Bay Texas City TX 42 1 Flint Hills Resources Corpus Christi East TX 41 3 CVR Coffeyville KS 40 1 Shell Norco Manufacturing Complex LA 37 2 Valero Texas City TX 33 1 ExxonMobil Baton Rouge LA 31 1
Refinery sampling period (2-week) net benzene concentration at the fenceline assessed against the Agency for Toxic Substances and Disease (ATSDR) Acute Minimal Risk Level of 9 parts per billion (30 micrograms per cubic meter), from January 2018 to September 2019.
The refinery with the highest benzene levels at the end of the third quarter of 2019 was the Philadelphia Energy Solutions (PES) refinery in Pennsylvania, whose annual average net concentration was over five times the EPA standard. The Philadelphia facility shut down last June after erupting in explosions and fires.
The second worst for benzene pollution at the end of the third quarter of 2019 was the HollyFrontier Navajo Artesia refinery in Artesia, New Mexico, where monitors at the plant’s fenceline detected benzene at amounts four times the EPA standard. Earlier in 2019, this refinery’s first annual average net benzene concentration was 290 micrograms per cubic meter, or over 32 times the EPA action level. When examining individual sampling periods, HollyFrontier’s Artesia refinery had by far the highest measured benzene reported to EPA, with a net sampling period concentration of 998 micrograms per cubic meter for the periods ending on 6/19/18 and 7/31/18, over 30 times the minimal risk level for acute exposure to benzene.
Regulatory Background
Petroleum refineries can release significant amounts of benzene and other hydrocarbons when turning crude oil into gasoline and other fuels or chemicals. Benzene and other toxic pollutants can be released at refineries from flares and other combustion devices, or as vapor from leaking production units, storage tanks, or wastewater treatment units. Emissions from these different sources can be unpredictable and difficult to measure. To better monitor this pollution and protect local residents from emissions, EIP and Earthjustice filed a lawsuit on behalf of seven community and environmental groups9 against the EPA in 2012 to set limits on hazardous air pollution from petroleum refineries. Responding to these concerns, EPA developed a 2015 rule requiring refineries to monitor benzene levels along the perimeter of their facilities, and to investigate and take corrective action when fenceline concentrations are high. In response to the 2015 regulations, both industry and environmental filed challenges to the refinery rules. The Trump EPA this week released a response to the challenges that kept the fenceline monitoring requirement in place.10 EIP’s report documents why it is important for this monitoring to continue to protect public health.
Federal Clean Air Act regulations found at 40 CFR part 63 subpart CC require all large refineries to implement a fenceline monitoring program for benzene emissions. Although

6
benzene is the pollutant focused on in the regulation, the monitoring network is intended to use benzene as a surrogate pollutant to track and limit overall fugitive emissions of hazardous air pollutants at the fenceline.11 This program requires the refinery to measure the benzene in the air at sampling locations regularly spaced along a facility’s perimeter. Fenceline monitors detect when benzene emissions from the refinery are abnormally high (e.g. from a leaking or malfunctioning process unit) so that the facility can take appropriate actions to address the source of the emissions.
The benzene concentrations are measured using monitoring tubes placed around the property boundary of the refinery. Each tube measures a sample of the ambient air at the fenceline over a continuous two-week period and is replaced by a new tube at the end of each sampling period. To isolate the facility’s contribution from the background benzene concentration, the refinery calculates a net concentration by subtracting the lowest individual sampling concentration from the highest individual sampling concentration for each two-week period.12 The refinery reports the benzene concentration difference for each two-week sampling period, and calculates an annual average difference from the most recent 26 two-week sampling periods to assess compliance with the action level in the rule. The fenceline reporting data is posted on a public EPA website.13 For details on how to obtain the EPA benzene reports, see the guide at the end of this report.
Action Level
The EPA action level for benzene established in the regulation is 9 micrograms per cubic meter of air, measured as an annual average of only the facility’s contribution (the benzene concentration difference, as noted above). If the annual average difference is greater than 9 micrograms per cubic meter, the concentration is above the action level. The refinery is not necessary in violation of the law, but it must conduct a root cause analysis to identify the source of emissions, and develop a plan to fix the problem. Within five days of determining that the action level has been exceeded, the refinery must initiate that analysis to determine the cause of the exceedance and to determine appropriate corrective action. The company responsible must conduct a root cause analysis and complete initial corrective actions within 45 days of discovering an exceedance.
EPA developed the fenceline action level by modeling benzene concentrations using industry-reported emission data for their facilities. The modeling found that the maximum benzene concentration expected at the fenceline for any facility was 9 micrograms per cubic meter, as an annual average.14 In fact, the average facility is expected to be far lower. The average maximum concentration across the facilities modeled by EPA was 0.8 micrograms per cubic meter. Only four facilities had a modeled concentration above 4 micrograms per cubic meter.
EPA states that their fenceline standards do not necessarily correlate to any particular metric related to risk,15 and the agency notes that the action level is not an ambient air standard. EPA is careful to note that the monitoring requirements are part of a system for developing work practices to assist refineries and the public, and are not established as a risk
7
reduction step. However, a number of refineries are reporting sustained, elevated benzene emissions that—when compared to health-based risk analyses—represent a potential health hazard.
Benzene Risk Long-Term/Chronic Exposure
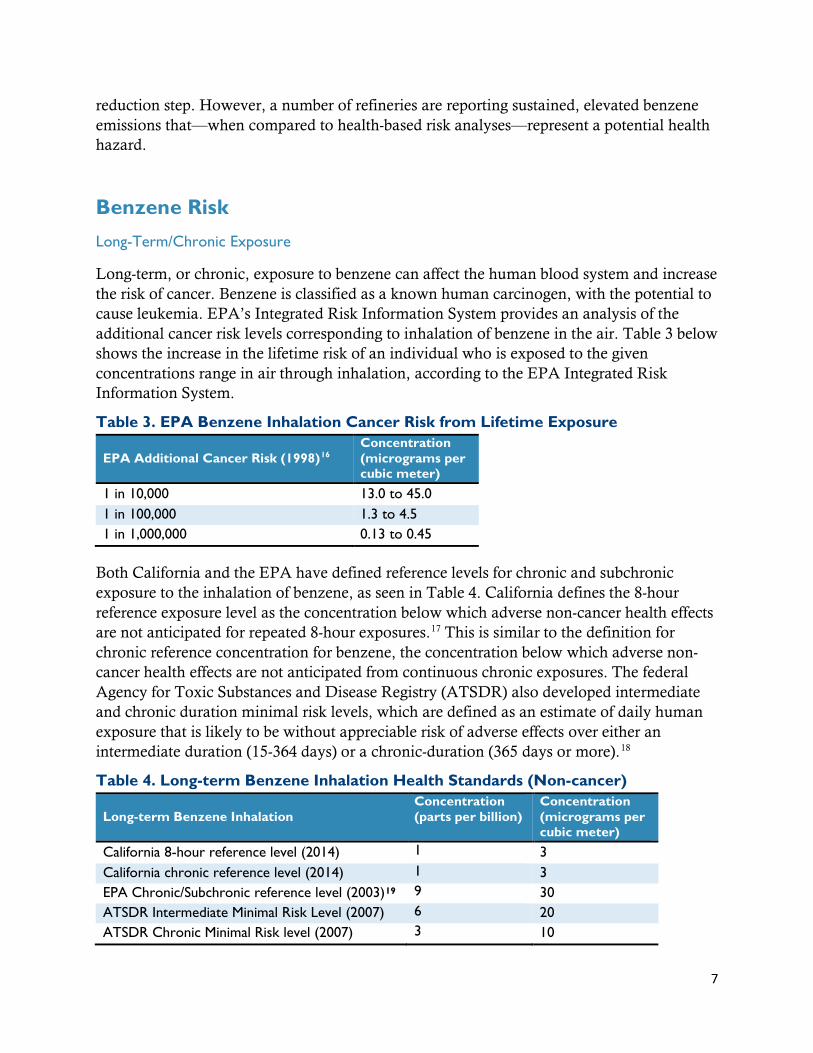
Long-term, or chronic, exposure to benzene can affect the human blood system and increase the risk of cancer. Benzene is classified as a known human carcinogen, with the potential to cause leukemia. EPA’s Integrated Risk Information System provides an analysis of the additional cancer risk levels corresponding to inhalation of benzene in the air. Table 3 below shows the increase in the lifetime risk of an individual who is exposed to the given concentrations range in air through inhalation, according to the EPA Integrated Risk Information System.
Table 3. EPA Benzene Inhalation Cancer Risk from Lifetime Exposure
EPA Additional Cancer Risk (1998)16 Concentration (micrograms per cubic meter)
1 in 10,000 13.0 to 45.0
1 in 100,000 1.3 to 4.5
1 in 1,000,000 0.13 to 0.45
Both California and the EPA have defined reference levels for chronic and subchronic exposure to the inhalation of benzene, as seen in Table 4. California defines the 8-hour reference exposure level as the concentration below which adverse non-cancer health effects are not anticipated for repeated 8-hour exposures.17 This is similar to the definition for chronic reference concentration for benzene, the concentration below which adverse non-cancer health effects are not anticipated from continuous chronic exposures. The federal Agency for Toxic Substances and Disease Registry (ATSDR) also developed intermediate and chronic duration minimal risk levels, which are defined as an estimate of daily human exposure that is likely to be without appreciable risk of adverse effects over either an intermediate duration (15-364 days) or a chronic-duration (365 days or more).18
Table 4. Long-term Benzene Inhalation Health Standards (Non-cancer)
Long-term Benzene Inhalation Concentration (parts per billion)
Concentration (micrograms per cubic meter)
California 8-hour reference level (2014) 1 3
California chronic reference level (2014) 1 3
EPA Chronic/Subchronic reference level (2003)19 9 30
ATSDR Intermediate Minimal Risk Level (2007) 6 20 ATSDR Chronic Minimal Risk level (2007) 3 10

8
Short-term/Acute Exposure
Short-term, or acute, exposure to benzene has been found to impact both the development of infants and the blood system. The California Office of Environmental Health Hazard Assessment developed an Acute Reference Exposure Level in 2014, defined as the level at or below which infrequent one-hour exposures are not expected to result in adverse health effects.20 Exposure to levels above the reference exposure level will increase the risk of the adverse effects due to the inhalation of benzene.
The California acute reference level agrees well with the federal minimal risk level for inhalation exposure to benzene. The federal value defines acute exposure as 14 days or less, and was derived largely from a different study and applied different uncertainty factors. The two documents are mutually supportive, and the fact that they arrived at the same conclusion strengthens the reliability of California’s acute reference level. Below is a summary of relevant values from both California and Agency for Toxic Disease Registry.
Table 5. Acute Benzene Inhalation Health Standards (Non-cancer)
Acute Benzene Inhalation Concentration (parts per billion)
Concentration (micrograms per cubic meter)
California Acute Reference Level (2014)21 8 27 ATSDR Acute Minimal Risk Level (2007)22 9 30
Fenceline Monitoring Data Analysis
EIP downloaded and reviewed refinery fenceline monitoring reports available to the public on an EPA website called WebFIRE, including Quarter 1, Quarter 2 and Quarter 3 data from 2019 (and any available 2018 and prior data).23 EIP’s review found 114 unique refinery monitoring networks,24 with 10 fenceline monitoring reports exceeding the EPA threshold for an annual average at the end of the most recent sampling period. Reports exceeding the 9 micrograms action level at the end of Quarter 3 are seen above in Table 1.
Additionally, it appears that the fenceline program is working as intended to identify problems and malfunction or “upset” events, where the emission spikes can be seen in elevated 2-week samples. Several facilities note the cause of elevated emissions in monitoring reports submitted to EPA (e.g. tank seal deficiencies, diesel leak, gasoline component roof failure). Some of these reports note that the problem was identified and corrected within 45 days. Additionally, we have seen some facilities successfully decrease their annual average net concentration over time, with several eventually achieving compliance with the action level after sustained periods of exceedance. Shell Norco Manufacturing, in Louisiana, and Valero Corpus Christi West, in Texas, both exceeded the action level for much of 2019, but were able to get down to or below the 9 microgram action level by the end of the third quarter.
9
Next, although EPA provides this data with the caveat that the action level is not directly tied to ambient air standards or health-based risk analysis, some of the reported benzene fenceline concentrations are alarming because they represent a concentration level that corresponds to an increased risk of cancer and other diseases over long-term exposure. As seen in Table 4, any exceedance of the action level is also an exceedance of the California 8-hour reference exposure level, as well as likely the federal chronic minimal risk level. As we are approaching nearly a year and three quarters of sampling data, some refineries are reporting recurring elevated levels that represent potential long-term exposure to benzene, not to mention other potential hazardous air pollutants for which benzene serves as a surrogate.25 When compared to EPA’s benzene cancer risk analysis, the highest emitting facilities on our list could represent an additional cancer risk of 4 in 10,000, when considering lifetime exposure. Similarly, the 10 refineries shown in Table 1 have long-term benzene concentrations that are more than three times higher than California’s exposure limit for increased risk of blood disorders and disease.
It is also necessary to note that the annual averages assessed in Table 1 show the net benzene levels at the fenceline, which represent the difference between the highest and lowest concentrations at the fenceline. The actual fenceline benzene concentrations in the air will instead be the sampling measurements, without the subtraction for background or correction for nearby sources in any site-specific monitoring plan. The actual benzene levels in adjacent neighborhoods can be higher or lower than the measurements at a refinery’s boundary line, depending on multiple factors that include emissions from non-refinery sources, weather conditions, wind direction, and distance from the facility.
10
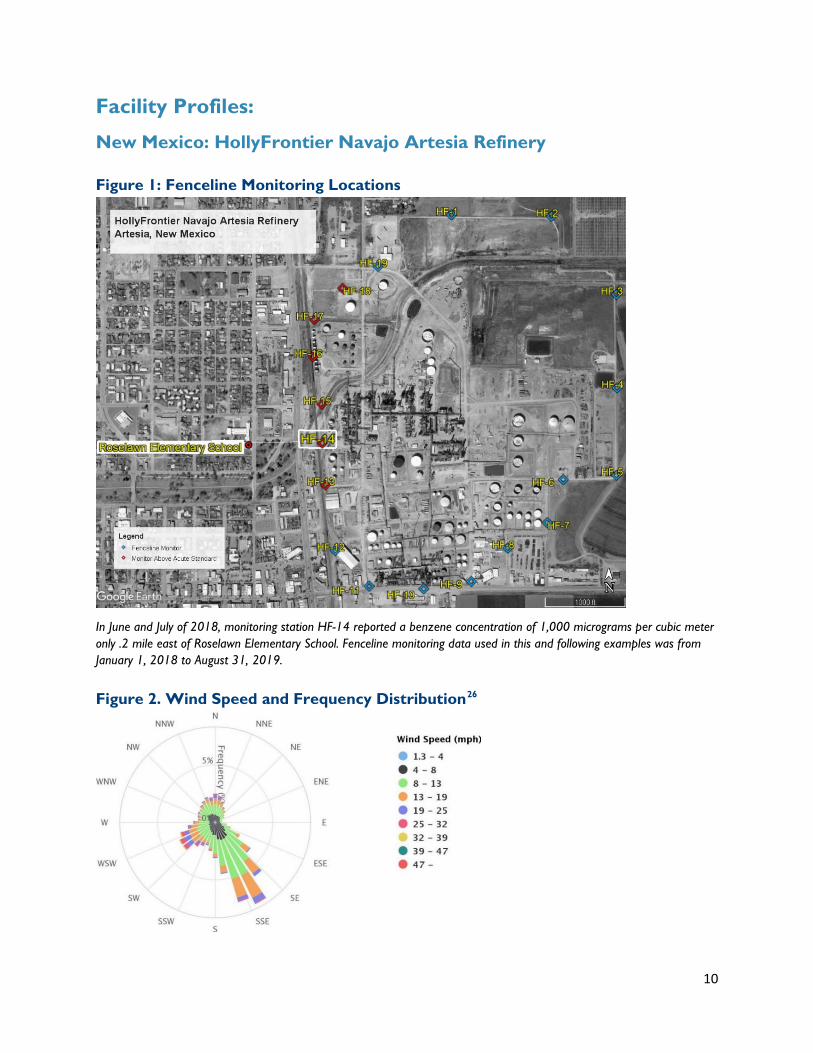
Facility Profiles:
New Mexico: HollyFrontier Navajo Artesia Refinery Figure 1: Fenceline Monitoring Locations
In June and July of 2018, monitoring station HF-14 reported a benzene concentration of 1,000 micrograms per cubic meter only .2 mile east of Roselawn Elementary School. Fenceline monitoring data used in this and following examples was from January 1, 2018 to August 31, 2019.
Figure 2. Wind Speed and Frequency Distribution26

11
Demographic Data within One-Mile Radius of Artesia Refinery27
Population % Below Poverty
Line
% African American
% Hispanic-
Origin
% Asian/Pacific
Islander
% American
Indian
% Seniors
% Children
3,318 56.6 2 74 0 2 12 9
To get a more complete picture of which monitors and readings are leading to the action level exceedances at the HollyFrontier Navajo Artesia refinery, we reviewed the sample result data and mapped the monitor locations around the site. We noted any “hot spots” in the sampling data where the maximum 2-week sample benzene concentration exceeded a level of 30 micrograms per cubic meter.28 These measurements may not only be contributing to exceedance of the annual action level, but also represent a level of emissions above the California acute reference levels that may represent an elevated risk due to inhalation exposure.
As seen in Figure 1, elevated benzene concentrations are found primarily on the west side of the Artesia refinery, with seven of the highest 10 readings occurring at monitoring location HF-14. Individual samples had alarmingly high concentrations, with two separate sampling periods at location HF-14 reporting a concentration of 1000 micrograms per cubic meter, above the calibration range and over 30 times the California acute reference exposure level. These benzene levels are especially concerning given the proximity of the community to the west fenceline of the facility. Businesses are located directly across the road from the fenceline, and Roselawn Elementary School is located just 0.2 miles directly west of the highest reading monitor (HF-14). Even though the primary wind direction is often toward the south or southeast, any wind toward the west or southwest, or calm conditions, may transport fenceline benzene into the surrounding community.

12
Pennsylvania: Philadelphia Energy Solutions Figure 3. Fenceline Monitoring Locations
Monitoring location PES-1 detected benzene levels in July 2019 at 190 micrograms per cubic meter, just .2 mile west of the Quartermaster Plaza Shopping Center Figure 4. Wind Speed and Frequency Distribution29
13
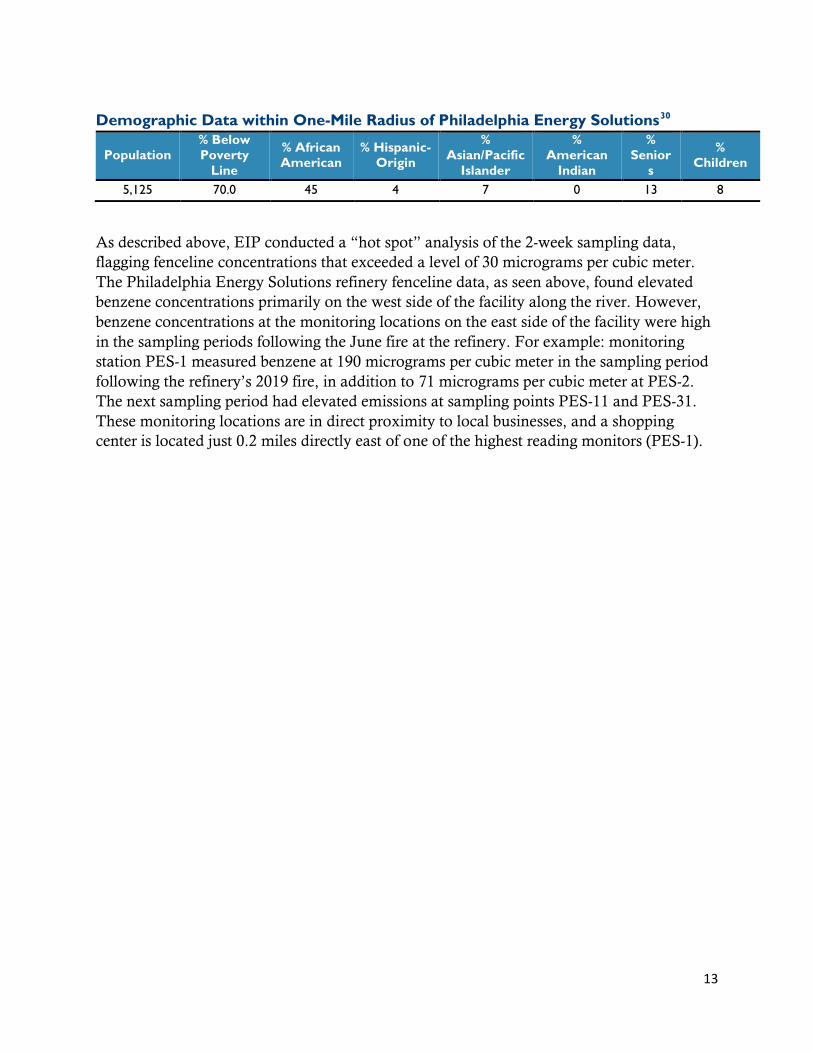
Demographic Data within One-Mile Radius of Philadelphia Energy Solutions30
Population % Below Poverty
Line
% African American
% Hispanic-Origin
% Asian/Pacific
Islander
% American
Indian
% Senior
s
% Children
5,125 70.0 45 4 7 0 13 8
As described above, EIP conducted a “hot spot” analysis of the 2-week sampling data, flagging fenceline concentrations that exceeded a level of 30 micrograms per cubic meter. The Philadelphia Energy Solutions refinery fenceline data, as seen above, found elevated benzene concentrations primarily on the west side of the facility along the river. However, benzene concentrations at the monitoring locations on the east side of the facility were high in the sampling periods following the June fire at the refinery. For example: monitoring station PES-1 measured benzene at 190 micrograms per cubic meter in the sampling period following the refinery’s 2019 fire, in addition to 71 micrograms per cubic meter at PES-2. The next sampling period had elevated emissions at sampling points PES-11 and PES-31. These monitoring locations are in direct proximity to local businesses, and a shopping center is located just 0.2 miles directly east of one of the highest reading monitors (PES-1).

14
Texas: Pasadena Refining Figure 5. Fenceline Monitoring Locations31
Kruse Elementary School east of Houston is located three quarters of a mile downwind from Pasadena Refining monitoring location R-10, where the highest benzene concentrations were detected. The maximum benzene sample concentration registered was 195 micrograms per cubic meter, on October 31, 2018.
Figure 6. Wind Speed and Frequency Distribution32

15
Demographic Data within One-Mile Radius of Pasadena Refining 33
Population % Below Poverty
Line
% African American
% Hispanic-
Origin
% Asian/Pacific
Islander
% American
Indian
% Seniors
% Children
1,599 56.3 3 80 1 1 5 11
EIP’s “hot spot” analysis of the 2-week sampling data at Pasadena Refining in Texas only flagged two monitors that had fenceline concentrations exceeding 30 micrograms per cubic meter: monitors R10 and VOC1. All but one of the acute exceedances occurred at monitor R10, located at the southern portion of the facility. Although the population within a one-mile radius is not as large as the HollyFrontier Artesia and Philadelphia Energy Solutions facilities, this refinery is directly upwind of neighborhoods to the south. Figure 6 above shows that the dominant wind direction in the area is to the south and southeast, which would transport pollution at the fenceline south toward the surrounding neighborhood. Kruse Elementary School is located three quarters of a mile downwind (to the south) of the monitor that logged the highest concentrations (R10).
16
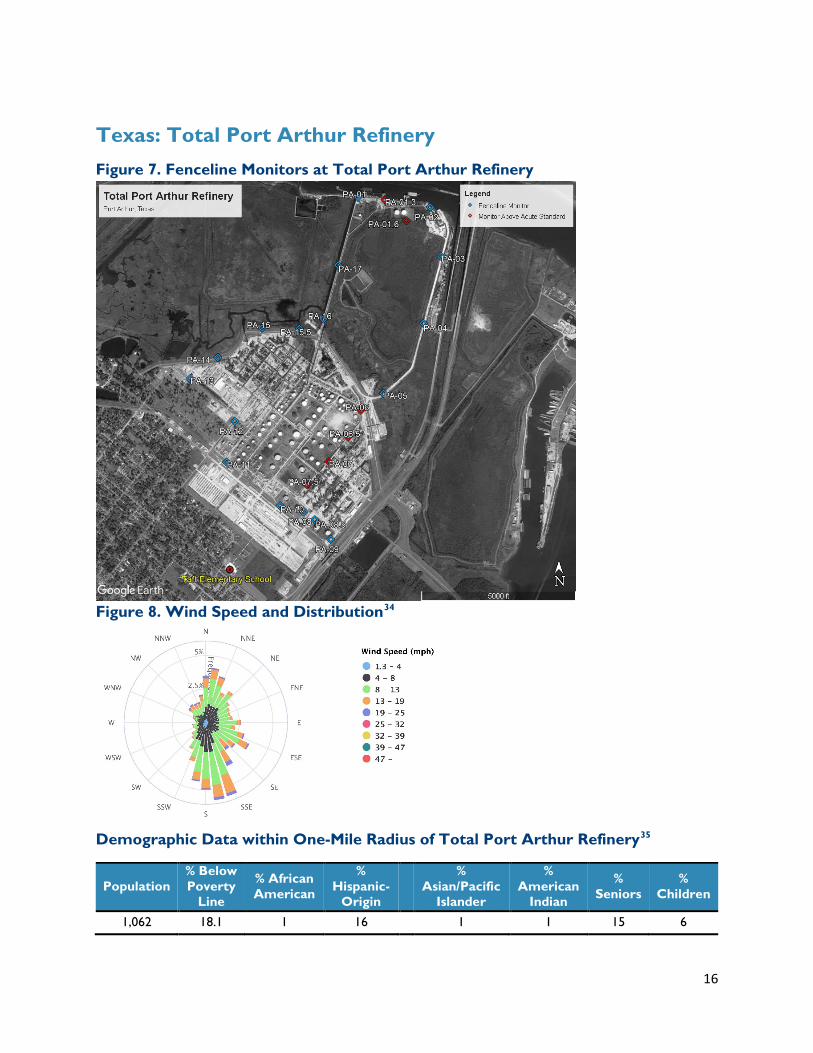
Texas: Total Port Arthur Refinery Figure 7. Fenceline Monitors at Total Port Arthur Refinery
Figure 8. Wind Speed and Distribution34
Demographic Data within One-Mile Radius of Total Port Arthur Refinery35
Population % Below Poverty
Line
% African American
% Hispanic-
Origin
% Asian/Pacific
Islander
% American
Indian
% Seniors
% Children
1,062 18.1 1 16 1 1 15 6

17
Texas: Flint Hill Resources Corpus Christi East
Figure 9. Fenceline Monitors at Flint Hill Resources Corpus Christi East
Figure 10. Wind Speed and Distribution36
Demographic Data within One-Mile Radius of FHR Corpus Christi East37
Population % Below Poverty
Line
% African American
% Hispanic-
Origin
% Asian/Pacific
Islander
% American
Indian
% Seniors
% Children
5,494 65.9 19 73 0 1 11 8
18
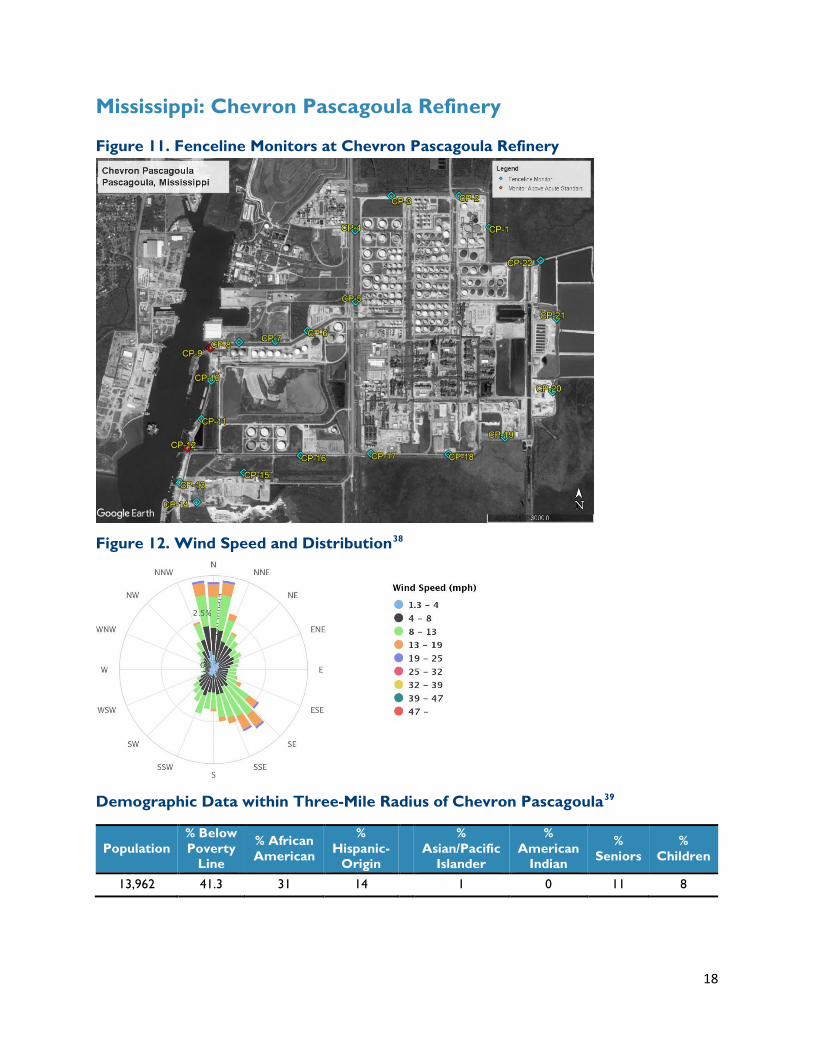
Mississippi: Chevron Pascagoula Refinery
Figure 11. Fenceline Monitors at Chevron Pascagoula Refinery
Figure 12. Wind Speed and Distribution38
Demographic Data within Three-Mile Radius of Chevron Pascagoula39
Population % Below Poverty
Line
% African American
% Hispanic-
Origin
% Asian/Pacific
Islander
% American
Indian
% Seniors
% Children
13,962 41.3 31 14 1 0 11 8

19
Texas: Valero Corpus Christi East Refinery Figure 13. Fenceline Monitors at Valero Corpus Christi East Refinery
Figure 14. Wind Speed and Distribution40
Demographic Data within One-Mile Radius of Valero Corpus Christi East41
Population % Below Poverty
Line
% African American
% Hispanic-
Origin
% Asian/Pacific
Islander
% American
Indian
% Seniors
% Children
2,636 89.0 6 81 0 1 13 7

20
Louisiana: Chalmette Refining Figure 15. Fenceline Monitors at Chalmette Refining
Figure 16. Wind Speed and Distribution42
Demographic Data within One-Mile Radius of Chalmette Refining43
Population % Below Poverty
Line
% African American
% Hispanic-
Origin
% Asian/Pacific
Islander
% American
Indian
% Seniors
% Children
4,530 31.9 15 8 2 1 13 6

21
Texas: Shell Deer Park Figure 17. Fenceline Monitors at Shell Deer Park
Figure 18. Wind Speed and Distribution44
Demographic Data within One-Mile Radius of Shell Deer Park45
Population % Below Poverty
Line
% African American
% Hispanic-
Origin
% Asian/Pacific
Islander
% American
Indian
% Seniors
% Children
498 13.5 1 37 1 0 5 9

22
Texas: Marathon Galveston Bay Figure 19. Fenceline Monitors at Marathon Galveston Bay
Figure 20. Wind Speed and Distribution46
Demographic Data within One-Mile Radius of Marathon Galveston Bay47
Population % Below Poverty
Line
% African American
% Hispanic-
Origin
% Asian/Pacific
Islander
% American
Indian
% Seniors
% Children
4,823 75.9 31 39 0 1 10 9

23
EPA Modeling Comparison
EPA developed the fenceline action level by modeling fenceline benzene concentrations using the emissions inventories reported in a 2011 refinery information collection request. EPA’s analysis adjusted for federal Clean Air Act air pollution control requirements, and modeled the post-control ambient benzene concentrations at each petroleum refinery using a model from the American Meteorological Society/EPA Regulatory Model Improvement Committee, called AERMOD. EPA states that “if the reported inventories are accurate, all facilities should be able to meet the fenceline concentration action level.”48 Below in Table 6 are EPA’s maximum modeled concentration for each facility, compared to the actual maximum annual average net concentrations from refineries.
Table 6. Refinery Fenceline Net Benzene Concentrations Versus EPA Modeled Concentrations
Facility Name State
Max Annual Average Net Concentration (micrograms per cubic meter)
EPA Modeled Max Annual Average Concentration (micrograms per cubic meter)
HollyFrontier Navajo Artesia NM 290 2.0
Philadelphia Energy Solutions PA 49 2.0
Total Refinery Port Arthur TX 27 0.3
Valero Corpus Christi East TX 22 0.3
Pasadena Refining TX 18 0.3
Shell Deer Park TX 17 0.4
Flint Hills Resources Corpus Christi East TX 16 0.2
Chalmette Refining LA 15 0.6
Chevron Pascagoula MS 15 0.8
Valero Corpus Christi West TX 12 0.8
Shell Norco Manufacturing LA 10 9.0
Marathon Galveston Bay Texas City TX 10 0.4 Numbers above reflect the highest net benzene concentrations (annual average) at the fenceline in micrograms per cubic meter of air over the monitoring program. Table 6 includes all facilities that at any point of the sampling program exceeded the annual action level, not just the ones at the end of the third quarter. As a full year of sampling data is needed for the annual average, these maximum rolling annual average concentrations are all within the period from January 2019 to September 2019.
There are several potential takeaways from reviewing the fenceline monitoring data. First, the occurrence of exceedances at the 12 facilities in Table 6 may indicate several things: 1. Required emission controls to meet the regulations are not working or operating as designed; or 2. Refineries significantly underestimated actual emissions in reported inventories used to establish the rule. Elevated net concentrations have also been seen to result from equipment failures and malfunctions, which may not be fully accounted for in modeling. Though some facilities have been able to reduce emission over time, the ten facilities above the action level in Table 1 show sustained emissions above the 9 micrograms action level throughout 2019, as seen in more detail in Appendix A.

24
Guide for Accessing EPA Benzene Reports
Below is a guide for journalists, researchers or other citizens who want to check EPA records for benzene levels monitored at the fencelines of a local refinery.
The refinery reports available on EPA site: https://cfpub.epa.gov/webfire/reports/esearch2.cfm
a. Enter Search terms for “CEDRI Submission Date” starting 01/01/2018 to the present date.
b. For “Regulatory Part and Subpart, select Part 63 – NESHAP and CFR Subpart CC: Petroleum Refineries.
c. If desired, add additional search terms to limit results, such as facility state. d. Submit search.
2. Downloading the report a. Submission date will typically be 45 days or less after the conclusion of the
sampling quarter. b. EPA notes that there may be up to a 30-day delay after submittal to appear on
the website. c. After locating the desired record, click the icon under the “Document” tab to
initiate download. d. Locate and unzip file from downloads.
3. Navigating the report a. “Welcome” and “Background” tabs contain information on the rule and
reporting. b. “Facility information” contains necessary facility name, address, sampling
year and sampling quarter information. Both facility name and quarter worth checking to ensure reviewing the desired report.
c. “Period Identifications” contains crucial data for assessing compliance with the action level. Column E “Sampling Period Change (Δc)” are the individual maximum 2-week difference, while Column F is the Annual Average (of the previous 26 Sampling Period Δc) which is assessed against the action level.
d. Individual sampler locations and results found in “Sampler Information” and “Sample Results” tabs.

25
End Notes: 1 Monitoring periods are two weeks. 2 Refineries subtract any background benzene coming from non-refinery sources when determining net benzene concentrations and whether annual average benzene concentrations exceed the 9 microgram threshold. 3 EPA refinery benzene monitoring data can be found on this agency website: https://cfpub.epa.gov/webfire/reports/esearch2.cfm 4 Shell Norco Manufacturing (Louisiana) and Valero Corpus Christi West (Texas) exceeded the action level for the majority of 2019, but reported at or just below the action level for the final sampling period of Quarter 3. 5 EPA Integrated Risk Information System. “Benzene Chemical Assessment Summary.” At 33 6 California OEHHA. “Technical Support Document for Noncancer RELs.” July 2014. Appendix D at 140. 7 The California OEHHA also developed an acute reference exposure level for acute inhalation exposure to benzene of 27 micrograms per cubic meter (or 8 parts per billion) that agrees well with the referenced ATSDR value of 9 parts per billion, found in the “Technical Support Document for Noncancer RELs” in Appendix D at 140. 8 This is defined as an estimate of daily exposure that is likely to be without appreciable risk of adverse effects over an acute duration (14 days or less). Source: Agency for Toxic Substances and Disease Registry (ATSDR) “Toxicological Profile for Benzene.” U.S. Department of Health and Human Services. August 2007, page 21 9 EIP represented Air Alliance Houston, Community In-Development Association, Louisiana Bucket Brigade, and Texas Environmental Justice Advocacy Services. Earthjustice was co-counsel and represented California Communities Against Toxics, Coalition for a Safe Environment, and Del Amo Action Committee. 10 “National Emission Standards for Hazardous Air Pollutants: Petroleum Refinery Sector,” Envionmental Protection Agency, 02/04/2020. https://www.federalregister.gov/documents/2020/02/04/2020-01108/national-emission-standards-for-hazardous-air-pollutants-petroleum-refinery-sector 11 80 Fed. Reg. at 75,196. 12 Refineries may also submit a site-specific monitoring plans for EPA approval to correct for nearby sources that may impact the benzene concentrations at certain monitors. Site-specific monitoring plans provide the option for the refinery to further account for any background or near-field sources that may be impacting monitor readings. As of the publishing date, 10 EPA-approved site-specific monitoring plans are up on the agency website, with one additional approved plan not yet available. 13 EPA refinery benzene monitoring data can be found on this agency website: https://cfpub.epa.gov/webfire/reports/esearch2.cfm 14 Memorandum to Brenda Shine, USEPA. “Fenceline Ambient Benzene Concentrations surrounding Petroleum Refineries.” January 7, 2014. Docket ID Number EPA–HQ–OAR–2010–0682. 15 79 Fed. Reg. at 36,926. 16 Id. at 33. 17 California OEHHA. “Technical Support Document for Noncancer RELs.” Appendix D. Updated July 2014. https://oehha.ca.gov/media/downloads/crnr/appendixd1final.pdf. 18ATSDR. “Toxicological Profile for Benzene.” U.S. Department of Health and Human Services. August 2007. At 23-24. Available at: https://www.atsdr.cdc.gov/toxprofiles/tp3.pdf. Presented as ppb and converted to micrograms per cubic meter. 19 EPA Integrated Risk Information System (IRIS). Presented as micrograms per cubic meter, converted to ppb. https://cfpub.epa.gov/ncea/iris/iris_documents/documents/subst/0276_summary.pdf at 12. 20 California OEHHA. “Technical Support Document for Noncancer RELs.” Appendix D at 182. Updated July 2014. https://oehha.ca.gov/media/downloads/crnr/appendixd1final.pdf 21 Reference Exposure Level Summary found at: https://oehha.ca.gov/air/general-info/oehha-acute-8-hour-and-chronic-reference-exposure-level-rel-summary and was last updated November 4, 2019. 22 ATSDR. Toxicological Profile for Benzene. August 2007. Available at: https://www.atsdr.cdc.gov/toxprofiles/tp.asp?id=40&tid=14. 23 WebFIRE reports found at https://cfpub.epa.gov/webfire/reports/esearch2.cfm, pulling reports submitted under Part 63 – NESHAP-CC Petroleum Refineries. Most recent reports downloaded 1/6/2020. 24 Note that refinery monitoring networks is different than unique refineries. For example, some refineries have separate monitoring systems set up for east and west portions of the same refinery facility, or separate monitors set up for refinery docks. 25 80 Fed. Reg. at 75,196. 26All wind speed and frequency distributions obtained using meteorological data from 1/1/2015-12/31/2019 from the Midwestern Regional Climate Center cli-MATE Tool, available at https://mrcc.illinois.edu/CLIMATE/Hourly/WindRose.jsp (available for free with registration). Data taken from meteorological station closest to a given facility. Artesia wind speed and direction distribution (wind rose) measured at Artesia Municipal Airport. 27 EPA Enforcement and Compliance History Online (ECHO). Navajo Refining CO Facility Report. Accessible at https://echo.epa.gov/detailed-facility-report?fid=110000472630#demographics110000472630 28 For the “hot spot” analysis, we reviewed individual sampler 2-week average benzene data, rather than the net benzene concentration data used in previous analyses. Sample results give the two-week average concentration of benzene measured at each specific monitor during a sampling period. In the case of facilities with a site-specific monitoring plan to correct for nearby sources, our “hot spot” analysis incorporated the corrected sampling period concentration instead of the measured concentration to be conservative.

26
29 Wind speed and direction distribution measured at Philadelphia International Airport 30 EPA Enforcement and Compliance History Online (ECHO). PES/Schuylkill Tank Farm Facility Report. Accessible at https://echo.epa.gov/detailed-facility-report?fid=110000336994#demographics110000336994. 31 The sampling period for this location was January 1, 2018 to October 10, 2019 32 Wind speed and direction distribution measured at William P. Hobby Airport 33 EPA Enforcement and Compliance History Online (ECHO). Pasadena Refining System Inc Facility Report. Accessible at https://echo.epa.gov/detailed-facility-report?fid=110000462703#demographics110000462703. 34 Wind speed and direction distribution measured at Port Arthur SE TX Airport 35 EPA Enforcement and Compliance History Online (ECHO). Atofina Petrochemicals Incorporated Facility Report. Accessible at https://echo.epa.gov/detailed-facility-report?fid=110000755200#demographics110000755200. 36 Wind speed and direction distribution measured at Corpus Christi International Airport 37 EPA Enforcement and Compliance History Online (ECHO). FHR East Plant Facility Report. Accessible at https://echo.epa.gov/detailed-facility-report?fid=110038173981#demographics110038173981. 38 Wind speed and direction distribution measured at Pascagoula Trent Lott International Airport 39 EPA Enforcement and Compliance History Online (ECHO). Chevron Products Pascagoula Facility Report. Accessible at https://echo.epa.gov/detailed-facility-report?fid=110000377477. One mile demographic data unavailable at publishing date. 40 Wind speed and direction distribution measured at Corpus Christi International Airport 41 EPA Enforcement and Compliance History Online (ECHO). Valero CC East Plant Facility Report. Accessible at https://echo.epa.gov/detailed-facility-report?fid=110000501993#demographics110000501993. 42 Wind speed and direction distribution measured at New Orleans Lakefront Airport 43 EPA Enforcement and Compliance History Online (ECHO). Chalmette Refining LLC Facility Report. Accessible at https://echo.epa.gov/detailed-facility-report?fid=110045634774#demographics110045634774. 44 Wind speed and direction distribution measured at Houston Ellington AFB 45 EPA Enforcement and Compliance History Online (ECHO). Shell Deer Park Refinery Facility Report. Accessible at https://echo.epa.gov/detailed-facility-report?fid=110064595399. 46 Wind speed and direction distribution measured at Galveston Scholes FLD 47 EPA Enforcement and Compliance History Online (ECHO). Marathon Petroleum LP Facility Report. Accessible at https://echo.epa.gov/detailed-facility-report?fid=110056967368. 48 79 Fed. Reg. at 36,926.

Appendix A. Net Benzene Levels for Refineries Exceeding Action Level as of September 30, 2019 (micrograms per cubic meter of air, annual average)
2-week Sampling Period (2019)*
Philadelphia Energy Solutions, PA
HF Navajo Artesia, NM
Total Port Arthur, TX
Pasadena, TX
FHR CC East, TX
Chevron Pascagoula, MS
Valero CC East, TX
Chalmette, LA
Shell Deer Park, TX
Marathon Galveston, TX
1 24 290 26.8 14 14.6 11.1 21 15 14.9 8.5 2 26 280 23.2 14 14.8 11.1 21 15 15.2 8.3 3 28 280 23.4 14 14.8 10.8 22 15 15.3 8.6 4 29 280 22.9 14 15 10.6 22 13 15.7 8.4 5 29 270 23.2 14 15 9.9 22 13 16.1 9.7 6 29 260 23.2 14 14.5 9.7 21 13 16.6 10 7 30 250 22.7 14 14.3 9.6 21 13 16.6 10 8 30 250 23.0 15 15 9.5 20 14 16.5 10 9 37 240 21.9 15 14.8 13.5 19 11 16.5 10 10 37 220 21.5 15 15 13.4 18 12 16.4 10 11 38 180 21.6 15 15.4 14.1 17 12 16.2 10 12 39 160 21.5 15 15 14.2 16 12.2 13.2 10 13 46 120 21.0 16 14.6 14.3 16 12.3 13.7 10 14 47 81 19.7 16 14.8 14.9 15 12.7 13.3 10 15 49 57 20.7 16 15.4 14.4 14 12.8 12.9 10 16 49 51 22.3 18 15.7 14.4 14 12.5 12.9 10 17 49 44 22.9 18 16.2 13.9 14 12.3 12.4 10 18 49 36 22.5 18 16.4 13.8 13 12.3 11.1 10 19
22.3 18 16.1
*Annual average net fenceline concentrations (Δc) represent the rolling annual average concentration (in micrograms per meter cubed) at the end of each two-week period that is assessed against the action level. Sampling began in January of 2018, and first annual average results became available in January of 2019. 2-week sampling periods between facilities do not always line up, and are therefore numbered to show each succeeding 2-week period in 2019 used to calculate the annual average (e.g. sampling period 1 represents the first 2019 2-week sampling period with a reported annual average).


