64
2021 First Quarter Report For the three months ended March 31, 2021 The GOLD Investment that WORKS
2021 First Quarter Report
For the three months ended March 31, 2021
The GOLD Investment that WORKS

2 0 2 1 F i r s t Q u a r t e r R e p o r t T h e G O L D I nve s t m e n t t h a t WO R K S 3
NEWS RELEASEToronto, May 5, 2021 (in U.S. dollars unless otherwise noted)
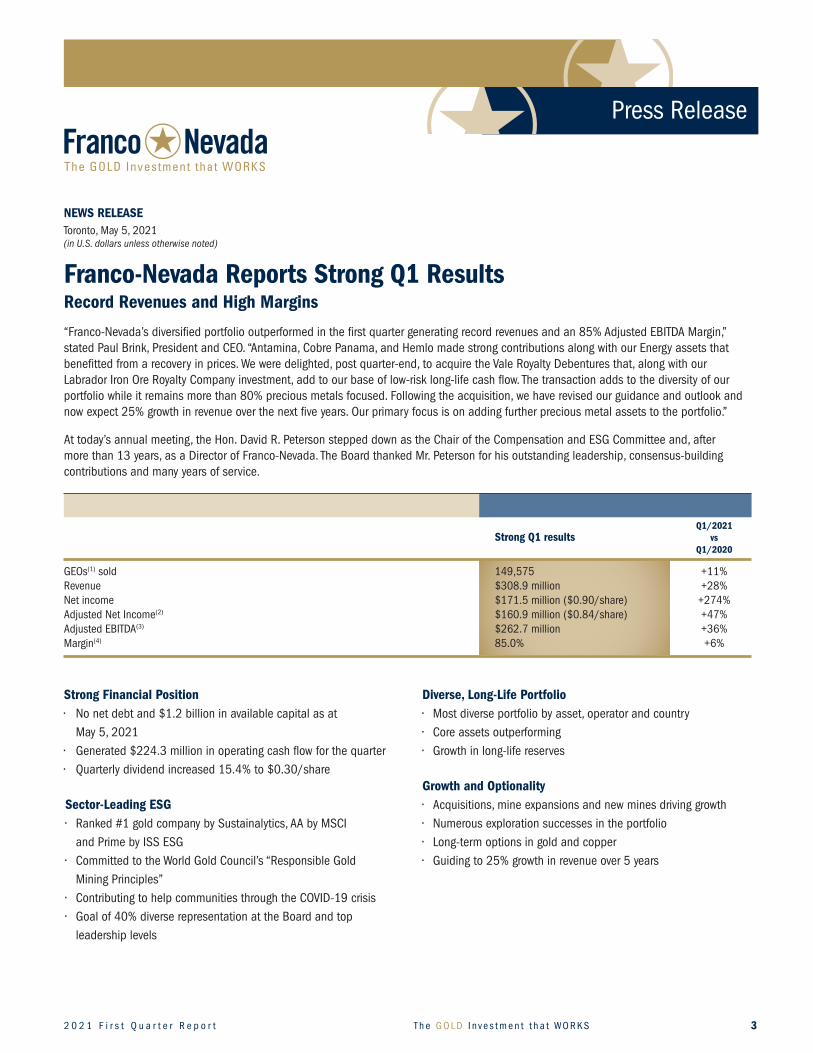
Franco-Nevada Reports Strong Q1 ResultsRecord Revenues and High Margins
“Franco-Nevada’s diversified portfolio outperformed in the first quarter generating record revenues and an 85% Adjusted EBITDA Margin,” stated Paul Brink, President and CEO. “Antamina, Cobre Panama, and Hemlo made strong contributions along with our Energy assets that benefitted from a recovery in prices. We were delighted, post quarter-end, to acquire the Vale Royalty Debentures that, along with our Labrador Iron Ore Royalty Company investment, add to our base of low-risk long-life cash flow. The transaction adds to the diversity of our portfolio while it remains more than 80% precious metals focused. Following the acquisition, we have revised our guidance and outlook and now expect 25% growth in revenue over the next five years. Our primary focus is on adding further precious metal assets to the portfolio.”
At today’s annual meeting, the Hon. David R. Peterson stepped down as the Chair of the Compensation and ESG Committee and, after more than 13 years, as a Director of Franco-Nevada. The Board thanked Mr. Peterson for his outstanding leadership, consensus-building contributions and many years of service.
Q1/2021 Strong Q1 results vs Q1/2020
GEOs(1) sold 149,575 +11%Revenue $308.9 million +28%Net income $171.5 million ($0.90/share) +274%Adjusted Net Income(2) $160.9 million ($0.84/share) +47%Adjusted EBITDA(3) $262.7 million +36%Margin(4) 85.0% +6%
Press Release
Strong Financial Position• Nonetdebtand$1.2billioninavailablecapitalasat May 5, 2021• Generated$224.3millioninoperatingcashflowforthequarter• Quarterlydividendincreased15.4%to$0.30/share
Sector-Leading ESG• Ranked#1goldcompanybySustainalytics,AAbyMSCI and Prime by ISS ESG• CommittedtotheWorldGoldCouncil’s“ResponsibleGold Mining Principles”• ContributingtohelpcommunitiesthroughtheCOVID-19crisis• Goalof40%diverserepresentationattheBoardandtop leadership levels
Diverse, Long-Life Portfolio • Mostdiverseportfoliobyasset,operatorandcountry• Coreassetsoutperforming• Growthinlong-lifereserves
Growth and Optionality• Acquisitions,mineexpansionsandnewminesdrivinggrowth• Numerousexplorationsuccessesintheportfolio• Long-termoptionsingoldandcopper• Guidingto25%growthinrevenueover5years
F N V T S X N Y S E F r a n c o - N eva d a C o r p o r a t i o n4
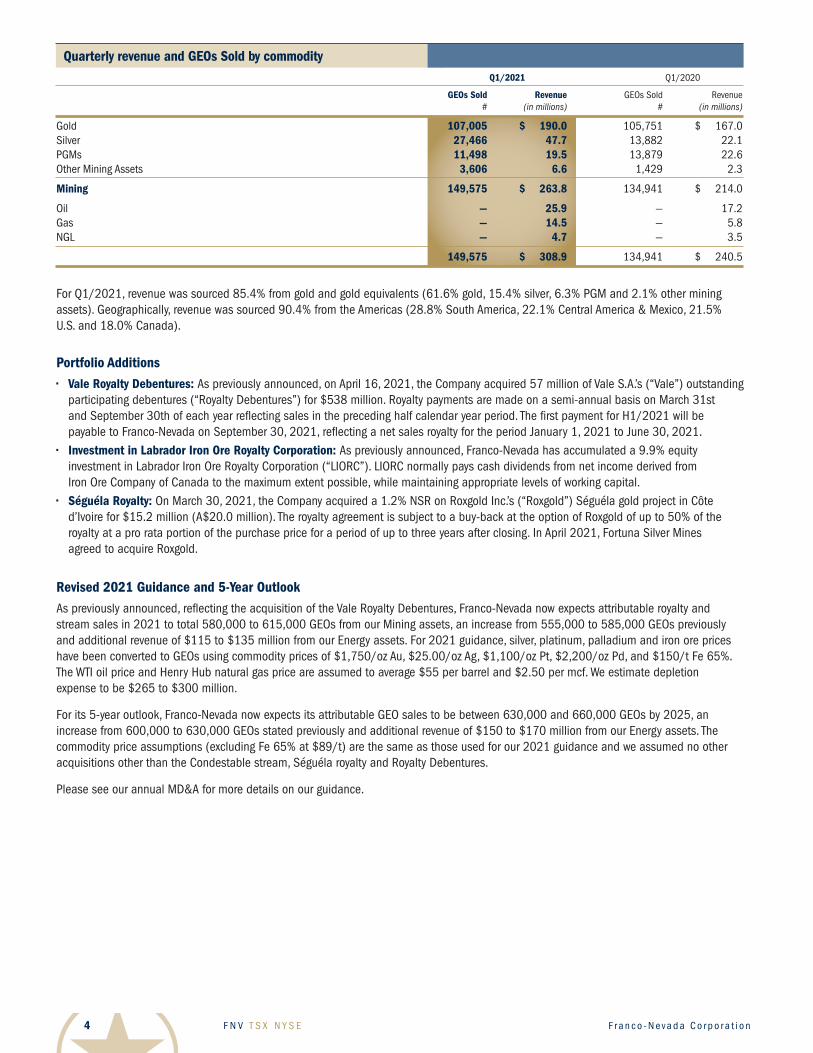
Quarterly revenue and GEOs Sold by commodity Q1/2021 Q1/2020
GEOs Sold Revenue GEOs Sold Revenue # (in millions) # (in millions)
Gold 107,005 $ 190.0 105,751 $ 167.0Silver 27,466 47.7 13,882 22.1PGMs 11,498 19.5 13,879 22.6Other Mining Assets 3,606 6.6 1,429 2.3
Mining 149,575 $ 263.8 134,941 $ 214.0
Oil — 25.9 — 17.2Gas — 14.5 — 5.8NGL — 4.7 — 3.5
149,575 $ 308.9 134,941 $ 240.5
For Q1/2021, revenue was sourced 85.4% from gold and gold equivalents (61.6% gold, 15.4% silver, 6.3% PGM and 2.1% other mining assets). Geographically, revenue was sourced 90.4% from the Americas (28.8% South America, 22.1% Central America & Mexico, 21.5% U.S. and 18.0% Canada).
Portfolio Additions• Vale Royalty Debentures: As previously announced, on April 16, 2021, the Company acquired 57 million of Vale S.A.’s (“Vale”) outstanding
participating debentures (“Royalty Debentures”) for $538 million. Royalty payments are made on a semi-annual basis on March 31st and September 30th of each year reflecting sales in the preceding half calendar year period. The first payment for H1/2021 will be payable to Franco-Nevada on September 30, 2021, reflecting a net sales royalty for the period January 1, 2021 to June 30, 2021.
• Investment in Labrador Iron Ore Royalty Corporation: As previously announced, Franco-Nevada has accumulated a 9.9% equity investment in Labrador Iron Ore Royalty Corporation (“LIORC”). LIORC normally pays cash dividends from net income derived from Iron Ore Company of Canada to the maximum extent possible, while maintaining appropriate levels of working capital.
• Séguéla Royalty: On March 30, 2021, the Company acquired a 1.2% NSR on Roxgold Inc.’s (“Roxgold”) Séguéla gold project in Côte d’Ivoire for $15.2 million (A$20.0 million). The royalty agreement is subject to a buy-back at the option of Roxgold of up to 50% of the royalty at a pro rata portion of the purchase price for a period of up to three years after closing. In April 2021, Fortuna Silver Mines agreed to acquire Roxgold.
Revised 2021 Guidance and 5-Year OutlookAs previously announced, reflecting the acquisition of the Vale Royalty Debentures, Franco-Nevada now expects attributable royalty and stream sales in 2021 to total 580,000 to 615,000 GEOs from our Mining assets, an increase from 555,000 to 585,000 GEOs previously and additional revenue of $115 to $135 million from our Energy assets. For 2021 guidance, silver, platinum, palladium and iron ore prices have been converted to GEOs using commodity prices of $1,750/oz Au, $25.00/oz Ag, $1,100/oz Pt, $2,200/oz Pd, and $150/t Fe 65%. The WTI oil price and Henry Hub natural gas price are assumed to average $55 per barrel and $2.50 per mcf. We estimate depletion expense to be $265 to $300 million.
For its 5-year outlook, Franco-Nevada now expects its attributable GEO sales to be between 630,000 and 660,000 GEOs by 2025, an increase from 600,000 to 630,000 GEOs stated previously and additional revenue of $150 to $170 million from our Energy assets. The commodity price assumptions (excluding Fe 65% at $89/t) are the same as those used for our 2021 guidance and we assumed no other acquisitions other than the Condestable stream, Séguéla royalty and Royalty Debentures.
Please see our annual MD&A for more details on our guidance.
2 0 2 1 F i r s t Q u a r t e r R e p o r t T h e G O L D I nve s t m e n t t h a t WO R K S 5
Q1/2021 Portfolio Updates Gold Equivalent Ounces Sold: GEOs sold for the quarter were 149,575, an increase of 10.8% from the 134,941 sold in Q1/2020. Higher contributions from Antamina, Hemlo, Cobre Panama and the recently acquired Condestable stream were partly offset by lower contributions from Sudbury and Guadalupe-Palmarejo.
South America:
• Antamina(22.5% silver stream) - GEOs delivered and sold were higher in Q1/2021, reflecting an increase in ounces sold and higher silver prices than one year earlier.
• Antapaccay (gold and silver stream) - GEOs delivered and sold were higher in Q1/2021 than one year earlier due to variations in the copper concentrate shipments.
• Candelaria (gold and silver stream) - GEOs delivered and sold in Q1/2021 were relatively consistent with Q1/2020. Production at Candeleria was higher this quarter than in the previous year due to higher mill throughput, but deliveries to Franco-Nevada remained flat due to timing of concentrate shipments. Precious metal production is expected at higher rates later in the year as the mine plan accesses higher grade ore.
• Condestable (gold and silver stream) - Franco-Nevada received its first deliveries from the recently acquired stream, with the asset contributing an incremental 3,255 GEOs in the quarter.
• CerroMoro (2% royalty) - Yamana reported that Cerro Moro returned to a more normalized activity level during the quarter following COVID-19 challenges in the prior year, and expects further improvements as the vaccination program ramps up in Argentina.
• TacaTaca (1% royalty) - In November 2020, First Quantum declared a maiden Mineral Reserve of over 7.7 million tonnes of contained copper and, in March 2021, filed an updated technical report. First Quantum is continuing with pre-development and feasibility
activities.
Central America & Mexico:
• CobrePanama (gold and silver stream) - GEOs delivered and sold were higher in Q1/2021 than one year earlier, as the mine continues its ramp-up. First Quantum reported record production at the mine in Q1/2021. 19.6 Mt of ore was processed in the quarter. Mining is expected to transition to softer ore later in the year and First Quantum is targeting 85 Mtpa of throughput for 2021.
• Guadalupe-Palmarejo(50% gold stream) - Sales from Guadalupe-Palmarejo were lower than in the same quarter in 2020. GEOs sold in the prior year period benefitted from higher feed grades and included 1,695 GEOs held in inventory at December 31, 2019.
U.S.:
• Stillwater (5% royalty) - GEOs from Stillwater increased from one year earlier, reflecting higher PGM production and strong platinum and palladium prices during the quarter.
• SouthArturo(4-9% royalty) - In April 2021, i-80 Gold announced positive results from its drill programs at El Niño, Phase 1 open pit and Phase 3 project. At El Niño, development of a ramp to access the deeper mineralization is under way and is expected to be completed in Q1 2023.
• CastleMountain(2.65% royalty) - In March 2021, Equinox Gold announced a positive feasibility study for the Phase 2 expansion. The Phase 2 project will expand run-of-mine heap leaching and incorporate milling of higher-grade ore, increasing production to an average of 218,000 ounces per year for 14 years followed by leach pad rinsing to recover residual gold. Life-of-mine production is estimated at 3.4 million ounces of gold.
• Marigold(1.75-5% royalties) - In March 2021, SSR Mining announced updated Mineral Reserves and Mineral Resources as at December 31, 2020. Including pad inventory, Mineral Reserves of 3.69 million gold ounces were reported, with M&I Resources inclusive of Reserves of 5.38 million gold ounces and Inferred Resources of 334,000 gold ounces.
• Rosemont(1.5% royalty) - As Hudbay evaluates its next steps for the Rosemont project, drilling activities advance at the Copper World deposits which are largely on private land and covered by Franco-Nevada’s royalty. Hudbay believes Copper World has the potential to host at least four economic deposits with a relatively low strip ratio and may prove to be a viable open-pit operation that is either separate from or additive to the Rosemont project.
Canada:
• Sudbury(50% gold and PGM stream) - In February 2021, KGHM approved an updated life of mine plan which extends mining operations at the McCreedy West mine for another 5 years.
• DetourLake(2% royalty) - In March 2021, Kirkland Lake Gold filed a technical report which included a new life of mine plan under which production is expected to average 680,000 to 720,000 ounces from 2021 to 2024, before increasing to 800,000 ounces in 2025 and reaching over 900,000 ounces in 2032. Kirkland Lake Gold also reported continued exploration success, including intersections in the Central Saddle Zone containing exceptional grades and widths.
• Hemlo(3% royalty & 50% NPI) - Revenue from Hemlo increased significantly relative to the same quarter in 2020 as the 50% NPI on Interlake benefitted from higher gold prices and increased production from grounds where Franco-Nevada has royalty interests. In addition, the Company recorded royalties of $8 million related to prior periods during the quarter.
• KirklandLake(1.5-5.5% royalty & 20% NPI) -KirklandLakeGoldreportedthattheMacassa#4Shaftremainsaheadofschedulewithshaft sinking reaching the 5,000-foot level at the end of the quarter.
F N V T S X N Y S E F r a n c o - N eva d a C o r p o r a t i o n6
• CanadianMalartic(1.5% royalty) - In March 2021, Agnico Eagle and Yamana filed an updated technical report. Development of the Barnat pit extension was completed in 2020 and mining will gradually transition from the Canadian Malartic pit to the Barnat pit. Based on current Mineral Reserves, the open-pit life of mine extends to 2028 after which mining will gradually transition from the open pit to underground. The Odyssey underground project is expected to extend the life of the complex to at least 2039.
• Hardrock(3% royalty) - In April 2021, Equinox Gold completed its acquisition of Premier Gold and the acquisition of an additional 10% interest in Hardrock, increasing its stake to 60%. Orion will hold the remaining 40% interest in the project.
• RedLake(Bateman)(2% royalty) - In March 2021, Evolution Mining agreed to acquire all of the issued and outstanding shares of Battle North. The acquisition is expected to create synergies between the Bateman project and Evolution’s existing operations in the region.
• ValentineLake(2% royalty) - In March 2021, Marathon Gold completed a feasibility study that outlines a 13-year mine life with an average production profile of 173,000 ounces of gold per year between 2024 and 2033 and 56,000 ounces of gold per year between 2034 and 2036 from the processing of low-grade stockpiles. Marathon Gold also reported a maiden Inferred Mineral Resource estimate for the new Berry Deposit of 638,700 ounces.
Rest of World:
• AgiDagi(2% royalty) - In April 2021, Alamos announced its filing of an investment treaty claim against the Republic of Turkey for failing to grant routine renewals of key licenses and permits for Alamos’ Kirazli gold mine. Though Franco-Nevada does not have a royalty on the Kirazli mine, cessation of development activities at Kirazli are expected to negatively impact the advancement of the Agi Dagi project.
Energy: Revenue from the Energy assets increased to $45.1 million in Q1/2021 compared to $26.5 million in Q1/2020. Revenues were positively impacted by higher oil and gas prices and the addition of royalty interests in the Haynesville shale play.
U.S.:
• Haynesville(various royalty rates) - The recently acquired portfolio of assets contributed $7.2 million of incremental revenue in Q1/2021. • PermianBasin(various royalty rates) - Revenue from Franco-Nevada’s interests in the Permian Basin increased compared to the same
quarter in the prior year due to incremental volumes from new wells and higher realized commodity prices. • Marcellus(1% royalty) - The royalty contributed $7.6 million to revenue in Q1/2021, an increase from Q1/2020, reflecting higher
realized prices. • SCOOP/STACK(various royalty rates) - Royalties from SCOOP/STACK were relatively flat compared to Q1/2020 with higher realized
pricing being offset by reduced drilling by the operators on royalty lands.
Canada:
• Weyburn(NRI, ORR, WI) - Revenue from Weyburn contributed $9.1 million in Q1/2021 compared to $4.2 million in Q1/2020, reflecting the NRI royalty’s leverage to increasing oil prices.
• Orion(4% GORR) - Revenue from Orion increased compared to Q1/2020 due to higher realized prices and despite slightly lower production levels for the quarter.
˘ ˘
˘ ̆
2 0 2 1 F i r s t Q u a r t e r R e p o r t T h e G O L D I nve s t m e n t t h a t WO R K S 7
Dividend increaseFranco-Nevada is pleased to announce that its Board of Directors has declared a quarterly dividend of $0.30 per share as had been previously announced. The dividend will be a 15.4% increase from the previous $0.26 per share quarterly dividend and will mark the 14th consecutive annual dividend increase for Franco-Nevada shareholders. The dividend will be paid on June 24, 2021 to shareholders of record on June 10, 2021 (the “Record Date”). The Canadian dollar equivalent is to be determined based on the daily average rate posted by the Bank of Canada on the Record Date. Under Canadian tax legislation, Canadian resident individuals who receive “eligible dividends” are entitled to an enhanced gross-up and dividend tax credit on such dividends.
The Company has a Dividend Reinvestment Plan (the “DRIP”). Participation in the DRIP is optional. The Company will issue additional common shares through treasury at a 3% discount to the Average Market Price, as defined in the DRIP. However, the Company may, from time to time, in its discretion, change or eliminate the discount applicable to treasury acquisitions or direct that such common shares be purchased in market acquisitions at the prevailing market price, any of which would be publicly announced. The DRIP and enrollment forms are available on the Company’s website at www.franco-nevada.com. Canadian and U.S. registered shareholders may also enroll in the DRIP online through the plan agent’s self-service web portal at www.investorcentre.com/franco-nevada. Canadian and U.S. beneficial shareholders should contact their financial intermediary to arrange enrollment. Non-Canadian and non-U.S. shareholders may potentially participate in the DRIP, subject to the satisfaction of certain conditions. Non-Canadian and non-U.S. shareholders should contact the Company to determine whether they satisfy the necessary conditions to participate in the DRIP.
This press release is not an offer to sell or a solicitation of an offer of securities. A registration statement relating to the DRIP has been filed with the U.S. Securities and Exchange Commission and may be obtained under the Company’s profile on the U.S. Securities and Exchange Commission’s website at www.sec.gov.
Corporate SummaryFranco-Nevada Corporation is the leading gold-focused royalty and streaming company with the largest and most diversified portfolio of cash-flow producing assets. Its business model provides investors with gold price and exploration optionality while limiting exposure to cost inflation. Franco-Nevada uses its free cash flow to expand its portfolio and pay dividends. It trades under the symbol FNV on both the Toronto and New York stock exchanges. Franco-Nevada is the gold investment that works.
For more information, please go to our website at www.franco-nevada.com or contact:
Sandip Rana Chief Financial Officer
(416) 306-6303 [email protected]
(1) Refer to note 1 at the bottom of page 11 of this Quarterly Report for the methodology for calculating GEOs and, for illustrative purposes, to the average commodity price tables on page 17 of this Quarterly Report for indicative prices which may be used in the calculation of GEOs for the periods ended March 31, 2021 and 2020.
(2) (3) (4) Cash Costs, Adjusted Net Income, Adjusted EBITDA, and Margin are non-IFRS financial measures with no standardized meaning under IFRS. For further information and a detailed reconciliation, please see the “Non-IFRS Financial Measures” section of this Quarterly Report.
FORWARD-LOOKINGSTATEMENTSPlease refer to Cautionary Statement on Forward-Looking Information on page 37 of this Quarterly Report.
F N V T S X N Y S E F r a n c o - N eva d a C o r p o r a t i o n8
Abbreviations used in this report
The following abbreviations may be used throughout this MD&A:
TableofContents9 Overview
10 Strategy
11 Highlights
14 Guidance
14 Market overview
15 Selected financial information
16 Revenue by asset
17 Review of quarterly financial performance
22 Impairment charges and reversals
22 General and administrative expenses
23 Other income and expenses
24 Summary of quarterly information
25 Balancesheetreview
26 Liquidity and capital resources
32 Critical accounting estimates
32 Outstanding share data
33 Internal control over financial reporting and
disclosure controls and procedures
33 Non-IFRS financial measures
37 Cautionary statement on forward-looking information
Abbreviated Definitions
Periods under review “H1/2021” The six-month period ending June 30, 2021“Q1/2021” The three-month period ended March 31, 2021“Q4/2020” The three-month period ended December 31, 2020“Q3/2020” The three-month period ended September 30, 2020“Q2/2020” The three-month period ended June 30, 2020“Q1/2020” The three-month period ended March 31, 2020“Q4/2019” The three-month period ended December 31, 2019“Q3/2019” The three-month period ended September 30, 2019“Q2/2019” The three-month period ended June 30, 2019
Places and currencies “U.S.” United States“$” or “USD” United States dollars“C$” or “CAD” Canadian dollars“A$” or “AUD” Australian dollars
Interest types“NSR” Net smelter return royalty“GR” Gross royalty“ORR” Overriding royalty“GORR” Gross overriding royalty“FH” Freehold or lessor royalty“NPI” Net profits interest“NRI” Net royalty interest“WI” Working interest
Measurement “GEO” Gold equivalent ounces“PGM” Platinum group metals“oz” Ounce“oz Au” Ounce of gold“oz Ag” Ounce of silver“oz Pt” Ounce of platinum“oz Pd” Ounce of palladium“65% Fe” 65% Fe iron ore fines, dry metric tonnes CFR China “LBMA” London Bullion Market Association“bbl” Barrel“boe” Barrels of oil equivalent“WTI” West Texas Intermediate“mcf” Thousand cubic feet
For definitions of the various types of agreements, please refer to our most recent Annual Information Form filed on SEDAR at www.sedar.com or our Form 40 F filed on EDGAR at www.sec.gov.
This Management’s Discussion and Analysis (“MD&A”) of financial position and results of operations of Franco-Nevada Corporation (“Franco-Nevada”, the “Company”, “we” or “our”) has been prepared based upon information available to Franco-Nevada as at May 5, 2021 and should be read in conjunction with Franco-Nevada’s unaudited condensed consolidated financial statements and related notes as at and for the three months ended March 31, 2021 and 2020 (the “financial statements”). The unaudited condensed consolidated financial statements and this MD&A are presented in U.S. dollars and have been prepared in accordance with International Financial Reporting Standards (“IFRS”) as issued by the International Accounting Standards Board (“IASB”) applicable to the preparation of condensed interim financial statements, including IAS 34, Interim Financial Reporting.
Readers are cautioned that the MD&A contains forward-looking statements and that actual events may vary from management’s expectations. Readers are encouraged to read the “Cautionary Statement on Forward-Looking Information” at the end of this MD&A and to consult Franco-Nevada’s unaudited consolidated financial statements for the three months ended March 31, 2021 and 2020 and the corresponding notes to the financial statements which are available on our website at www.franco-nevada.com, on SEDAR at www.sedar.com and on Form 6-K furnished to the United States Securities and Exchange Commission on EDGAR at www.sec.gov.
Additional information related to Franco-Nevada, including our Annual Information Form and Form 40-F, are available on SEDAR at www.sedar.com and on EDGAR at www.sec.gov, respectively. These documents contain descriptions of certain of Franco-Nevada’s producing and advanced royalty and stream assets, as well as a description of risk factors affecting the Company. For additional information, please see our website at www.franco-nevada.com.
Management’s Discussion and Analysis
2 0 2 1 F i r s t Q u a r t e r R e p o r t T h e G O L D I nve s t m e n t t h a t WO R K S 9
Overview Franco-Nevada is the leading gold-focused royalty and streaming company with the largest and most diversified portfolio of royalties and streams by commodity, geography, operator, revenue type and stage of project.
Franco-Nevada asset count at May 5, 2021
Mining Energy TOTAL
Producing 58 55 113Advanced 42 – 42Exploration 224 27 251
TOTAL 324 82 406
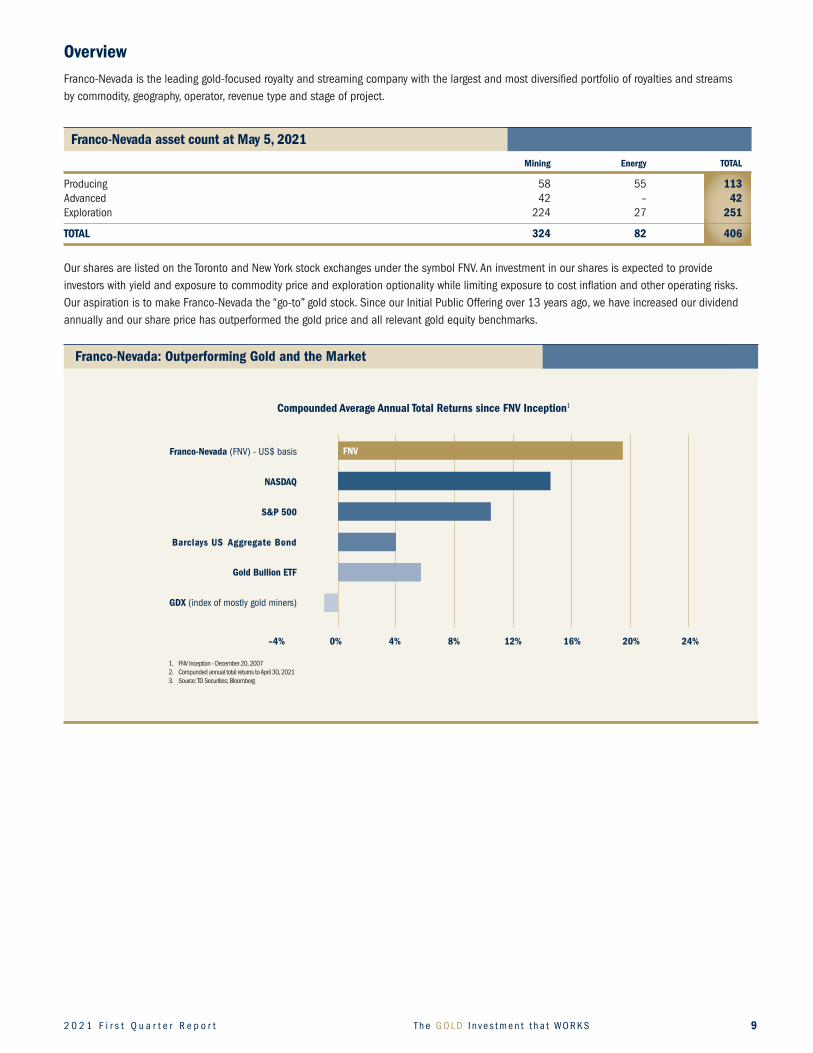
Our shares are listed on the Toronto and New York stock exchanges under the symbol FNV. An investment in our shares is expected to provide investors with yield and exposure to commodity price and exploration optionality while limiting exposure to cost inflation and other operating risks. Our aspiration is to make Franco-Nevada the “go-to” gold stock. Since our Initial Public Offering over 13 years ago, we have increased our dividend annually and our share price has outperformed the gold price and all relevant gold equity benchmarks.
Franco-Nevada: Outperforming Gold and the Market
CompoundedAverageAnnualTotalReturnssinceFNVInception1
Q1’21Based on TD SecuritiesUp to April 30, 2021, info to come
20% 24%12% 16%4% 8%
NASDAQ
S&P 500
Barclays US Aggregate Bond
Gold Bullion ETF
GDX (index of mostly gold miners)
FNV
–4% 0%
1. FNV Inception - December 20, 20072. Compunded annual total returns to April 30, 20213. Source: TD Securities; Bloomberg
Franco-Nevada (FNV) - US$ basis
20 % 24 %12 % 16 %4 % 8 %
NASDAQ
S&P 500
Barclays US Aggregate Bond
Gold Bullion ETF
GDX (indice de la majorité des sociétés aurifères)
FNV
–4 % 0 %
1. Création de FNV – 20 décembre 20072. Rendement total annuel composé au 26 février 20213. Source : Valeurs Mobilières TD; Bloomberg
Franco-Nevada (FNV) - en dollars américains
English
French
F N V T S X N Y S E F r a n c o - N eva d a C o r p o r a t i o n10
StrategyFranco-Nevada is the gold investment that works for all its stakeholders, including shareholders, operating partners and communities:
• Webelievethatcombininglowerriskgoldinvestmentswithastrongbalancesheet,progressivelygrowingdividendsandexposuretoexplorationsuccess and price optionality is the right mix to appeal to investors seeking to hedge market instability.
• Webuildlong-termalignmentwithouroperatingpartners.Thisalignmentandthenaturalflexibilityofourroyaltiesandstreamsisaneffectivefinancing tool for the cyclical resource sector.
• Weworktobeapositiveforceinallourcommunities,notonlybysponsoringcommunityprograms,butbyensuringhighgovernancestandards,providing a safe, ethical and diverse workplace and promoting responsible mining and energy production.
Our revenue is generated from various forms of agreements, ranging from net smelter return royalties, streams, net profits interests, net royalty interests, working interests and other types of arrangements. We do not operate mines, develop projects or conduct exploration. Franco-Nevada has a free cash flow generating business with limited future capital commitments and management is focused on managing and growing its portfolio of royalties and streams. We have a long-term investment outlook and recognize the cyclical nature of the industry. We aim to maintain a strong balance sheet so that we can make investments during commodity cycle downturns.
The advantages of this business model are:
• Exposuretocommoditypriceoptionality;• Aperpetualdiscoveryoptionoverlargeareasofgeologicallyprospectivelands;• Noadditionalcapitalrequirementsotherthantheinitialinvestment;• Limitedexposuretocostinflation;• Afreecash-flowbusinesswithlimitedcashcalls;• Ahigh-marginbusinessthatcangeneratecashthroughtheentirecommoditycycle;• Ascalableanddiversifiedbusinessinwhichalargenumberofassetscanbemanagedwithasmallstableoverhead;and• Managementthatfocusesonforward-lookinggrowthopportunitiesratherthanoperationalordevelopmentissues.
Franco-Nevada’s financial results in the short term are primarily tied to the price of commodities and the amount of production from its portfolio of assets. Financial results have also typically been supplemented by acquisitions of new assets. Over the longer term, results are impacted by the availability of exploration and development capital applied by other companies to expand or extend Franco-Nevada’s producing assets or to advance Franco-Nevada’s advanced and exploration assets into production.
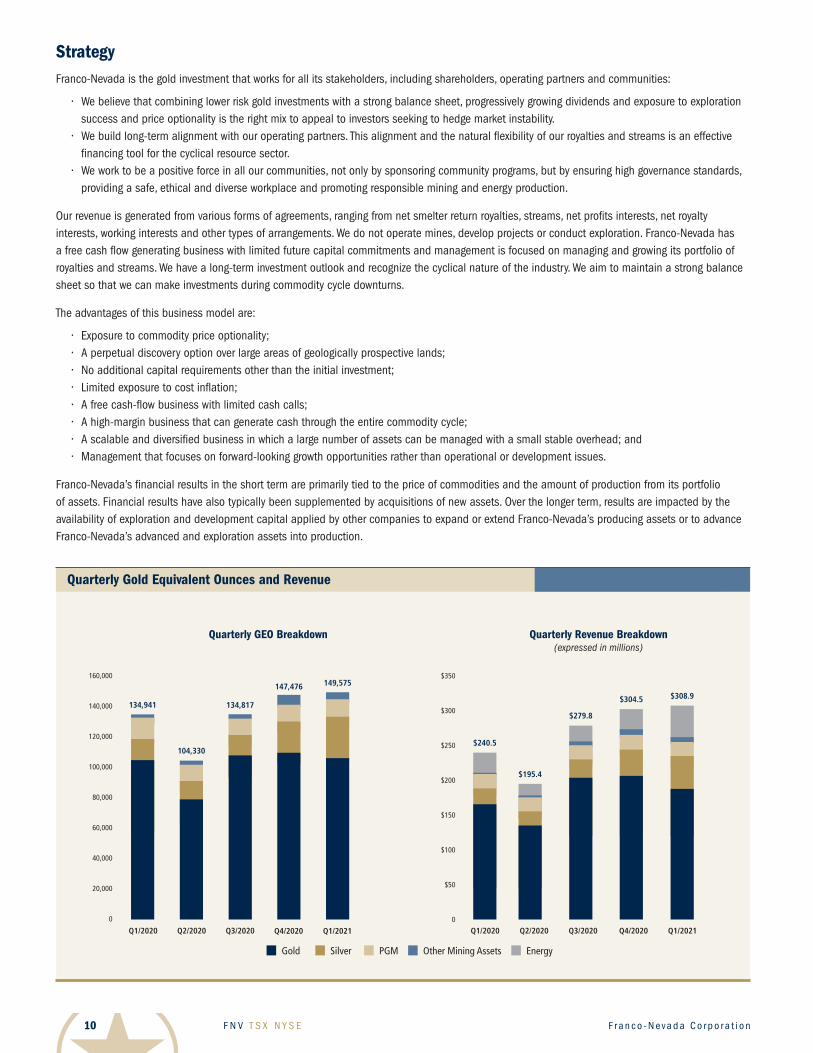
Quarterly Gold Equivalent Ounces and Revenue
QuarterlyGEOBreakdown QuarterlyRevenueBreakdown(expressed in millions)
Gold Silver PGM Other Mining Assets Energy
$308.9
$279.8
$304.5
$195.4
Q1/2021
134,941
160,000
140,000
120,000
100,000
80,000
60,000
40,000
20,000
0
Q3/2020 Q4/2020Q1/2020 Q2/2020 Q2/2020 Q3/2020 Q4/2020Q1/2020
$240.5
Q1/2021
$350
$300
$250
$200
$150
$100
$50
0
Quarterly GEO Breakdown_q1’21 Quarterly Revenue Breakdown_q1’21
149,575
134,817
147,476
104,330
2 0 2 1 F i r s t Q u a r t e r R e p o r t T h e G O L D I nve s t m e n t t h a t WO R K S 11
The focus of our business is to create exposure to gold and precious metal resource optionality. This principally involves investments in gold mines and providing financing to copper and nickel mines to obtain exposure to by-product gold, silver and platinum group metals production. We also invest in other metals and energy to expose our shareholders to additional resource optionality. In Q1/2021, 85.4% of our revenue was earned from gold and gold equivalents.
One of the strengths of the Franco-Nevada business model is that our margins are not generally impacted when producer costs increase. The majority of our interests are royalty and stream payments/deliveries that are based on production levels with no adjustments for the operator’s operating cost. In Q1/2021, these accounted for 87.7% of our revenue. We also have a small number of NPI and NRI royalties which are based on the profit of the underlying operations.
Highlights
Financial Update - Q1/2021 vs Q1/2020
• $308.9 million in revenue, an increase of 28.4%, comprising: • 149,575 GEOs(1)soldinQ1/2021,anincreaseof10.8%; • $45.1 million in Energy revenue,anincreaseof70.2%;• $37.7 million, or $252 per GEO sold, in Cash Costs(2)attributabletoGEOproduction,comparedto$41.5million,or$308perGEOsold;• $262.7million,or$1.37pershare,ofAdjustedEBITDA(2),anincreaseof36.3%and34.3%,respectively;• 85.0% in Margin(2),comparedto80.1%;• $171.5 million, or $0.90 per share, in net income, comparedtoanetlossof$98.8million,or$0.52pershare;• $160.9million,or$0.84pershareinAdjustedNetIncome(2),anincreaseof47.3%and44.8%,respectively;• $224.3 million in net cash provided by operating activities,anincreaseof14.9%;• $538.5 million in cash and cash equivalentsasatMarch31,2021;• $1.8 billion in available capital as at March 31, 2021, of which $538.0 million was subsequently used for the acquisition of Vale S.A.’s
participating debentures, referenced below.
Significant Portfolio Updates
Additional updates related to our portfolio of assets are available in our News Release issued on May 5, 2021, available on SEDAR at www.sedar.com and EDGAR at www.sec.gov.
Update on impact of COVID-19 pandemic
We continue to monitor the impact of the COVID-19 pandemic on our portfolio of assets. While there has been a resurgence of cases in various parts of the world, including those due to more transmissible variant strains, the impact on the Company’s operations and assets has been limited. Our workforce continues to work remotely and, during the quarter, none of the operations in which we hold a royalty, stream or other interest were suspended as a result of the pandemic. The Company continues to monitor the potential impact of the COVID-19 pandemic on the operations in which it holds a royalty, stream or other interest.
ExtensionofminingoperationsatSudbury(McCreedyWestmine)
In February 2021, the operator of the Company’s Sudbury asset, KGHM International Ltd. (“KGHM”), approved an extension of mining operations at the McCreedy West mine. Franco-Nevada assessed that the extension of the life of mine plan was an indication of a reversal of a previously recognized impairment loss and carried out an impairment reversal assessment. While the estimated recoverable value was estimated at $32.7 million, there was no impairment reversal as the carrying value that would have been determined without the previously recorded impairment loss, net of depletion, was nil.
(1) GEOs include Franco-Nevada’s attributable share of production from our Mining assets, after applicable recovery and payability factors, and do not include Energy assets. GEOs are estimated on a gross basis for NSR royalties and, in the case of stream ounces, before the payment of the per ounce contractual price paid by the Company. For NPI royalties, GEOs are calculated taking into account the NPI economics. Silver, platinum, palladium and other mining commodities are converted to GEOs by dividing associated revenue, which includes settlement adjustments, by the relevant gold price. The price used in the computation of GEOs earned from a particular asset varies depending on the royalty or stream agreement, which may make reference to the market price realized by the operator, or the average price for the month, quarter, or year in which the mining commodity was produced or sold. For illustrative purposes, please refer to the average commodity price table on page 17 of this MD&A for indicative prices which may be used in the calculation of GEOs for the quarters ended March 31, 2021 and 2020.
(2) Cash Costs, Adjusted Net Income, Adjusted EBITDA, and Margin are non-IFRS financial measures with no standardized meaning under IFRS. For further information and a detailed reconciliation, please see the “Non-IFRS Financial Measures” section of this MD&A.
F N V T S X N Y S E F r a n c o - N eva d a C o r p o r a t i o n12
Corporate Developments
AcquisitionofValeRoyaltyDebentures-Brazil
On April 16, 2021, the Company acquired 57 million of Vale S.A.’s (“Vale”) outstanding participating debentures (“Royalty Debentures”) for $538 million. The Royalty Debenture terms, on a 100% basis, provide for a 1.8% (0.264% attributable) net sales royalty on (i) iron ore sales from Vale’s Northern System, including the Serra Norte, Serra Sul and Serra Leste operations, and (ii) an estimated 70% of iron ore sales from Vale’s Southeastern System, in the medium term, including from the Itabira, Minas Centrais (Brucutu) and Mariana (Fazendão) mining complexes. The Southeastern System will start contributions under the Royalty Debentures once a cumulative sales threshold of 1.7 Bt of iron ore has been reached, forecast by Vale to be achieved during 2024. The Royalty Debentures also provide for a 2.5% (0.367% attributable) net sales royalty on certain copper and gold assets. The Royalty Debentures apply on a 50% basis (i.e. 1.25% of net sales, 0.183% attributable) to the Sossego mine. Additionally, the Royalty Debentures provide for a 1% (0.147% attributable) net sales royalty on all other minerals (covered mining rights include prospective deposits for other minerals including zinc and manganese, amongst others), subject to certain thresholds. 1% (0.147% attributable) also applies to proceeds in the event of an underlying asset sale.
Royalty payments are made on a semi-annual basis on March 31st and September 30th of each year reflecting production in the preceding half calendar year period. The first payment for H1/2021 will be payable to Franco-Nevada on September 30, 2021, reflecting a net sales royalty for the period January 1, 2021 to June 30, 2021.
The transaction was financed with a combination of cash on hand and a draw of $150.0 million on the Company’s $1 billion corporate revolving credit facility. Management has determined that the Royalty Debentures are economically equivalent to royalty interests with no maturity until the underlying mining rights are extinguished and will be accounting for them as an acquisition of a mineral interest.
Investment in Labrador Iron Ore Royalty Corporation - Canada
Franco-Nevada has accumulated a 9.9% equity investment in Labrador Iron Ore Royalty Corporation (“LIORC”). The position was acquired over a number of years for a total investment of $74.2 million (C$93 million), representing an average cost of $11.72 (C$14.72) per share. The investment in LIORC functions similar to a royalty given the flow through of revenue generated from LIORC’s underlying 7% gross overriding royalty interest, C$0.10 per tonne commission, and 15.1% equity interest in Iron Ore Company of Canada’s (“IOC”) Carol Lake mine, operated by Rio Tinto. LIORC normally pays cash dividends from net income derived from IOC to the maximum extent possible, while maintaining appropriate levels of working capital. Dividends from LIORC received by Franco-Nevada are reflected in revenue from Other Mining Assets and included in the calculation of GEOs sold.
Acquisition of Séguéla Royalty - Côte d’Ivoire
On March 30, 2021, the Company acquired a 1.2% NSR on Roxgold Inc.’s (“Roxgold”) Séguéla gold project in Côte d’Ivoire for $15.2 million (A$20.0 million). The royalty agreement is subject to a buy-back at the option of Roxgold of up to 50% of the royalty at a pro rata portion of the purchase price for a period of up to three years after closing. In April 2021, Fortuna Silver Mines Inc. agreed to acquire Roxgold.
2 0 2 1 F i r s t Q u a r t e r R e p o r t T h e G O L D I nve s t m e n t t h a t WO R K S 13
Acquisition of Condestable Gold and Silver Stream - Peru
On March 8, 2021, the Company, through a wholly-owned subsidiary, closed a precious metals stream agreement with reference to the gold and silver production from the Condestable mine in Peru, for an up-front deposit of $165.0 million. The Condestable mine is located approximately 90 kilometers south of Lima, Peru and is owned and operated by a subsidiary of Southern Peaks Mining LP (“SPM”), a private company. Commencing on January 1, 2021 and ending December 31, 2025, Franco-Nevada will receive 8,760 ounces of gold and 291,000 ounces of silver annually until a total of 43,800 ounces of gold and 1,455,000 ounces of silver have been delivered (the “Fixed Deliveries”). Thereafter, Franco-Nevada will receive 63% of the contained gold and contained silver produced until a cumulative total of 87,600 ounces of gold and 2,910,000 ounces of silver have been delivered (the “Variable Phase 1 Deliveries”). The stream then reduces to 25% over the remaining life of mine (the “Variable Phase 2 Deliveries”). Franco-Nevada will pay 20% of the spot price for gold and silver for each ounce delivered under the stream (the “Ongoing Payment”). The stream has an effective date of January 1, 2021, with the first quarterly delivery received March 15, 2021.
For a period of four years from closing, subject to certain restrictions, a subsidiary of SPM may, at its option, make a one-time special delivery comprising the number of ounces of refined gold equal to $118.8 million at the then current spot price subject to the Ongoing Payment, to achieve the early payment of the Fixed Deliveries and Variable Phase 1 Deliveries. The Variable Phase 2 Deliveries would commence immediately thereafter.
Acquisition of U.S. Oil & Gas Royalty Rights with Continental Resources, Inc.
The Company, through a wholly-owned subsidiary, has a strategic relationship with Continental Resources. Inc. (“Continental”) to acquire, through a jointly-owned entity (the “Royalty Acquisition Venture”), royalty rights within Continental’s areas of operation. In Q1/2021, Franco-Nevada recorded contributions to the Royalty Acquisition Venture of $1.2 million (Q1/2020 - $16.8 million). As at March 31, 2021, the cumulative investment in the Royalty Acquisition Venture by the Company totaled $407.2 million and Franco-Nevada has remaining commitments of up to $112.8 million, approximately half of which is expected to be deployed in the remainder of 2021.
FinancingCredit Facilities
As at March 31, 2021, the Company had no amounts drawn against its $1.0 billion unsecured revolving term credit facility (the “Corporate Revolver”). However, subsequent to quarter-end, on April 12, 2021, the Company drew down $150.0 million from its Corporate Revolver to finance part of the acquisition of the Vale Royalty Debentures. Further, the Company has posted security in the form of standby letters of credit in the amount of $18.4 million (C$23.1 million) in connection with the audit by the Canada Revenue Agency (“CRA”). The standby letters of credit reduce the available balance under the Corporate Revolver.
On March 16, 2021, Franco-Nevada (Barbados) Corporation amended its $100.0 million unsecured revolving credit facility (the “FNBC Revolver”) to extend the term to March 20, 2022. As at March 31, 2021, the Company had no amounts outstanding against the FNBC Revolver.
Dividend Increase As had been previously announced, Franco-Nevada is pleased that its Board of Directors has declared a quarterly dividend of $0.30 per share to be payable on June 24, 2021 to shareholders of record on June 10, 2021. The dividend will be a 15.4% increase from the previous $0.26 per share quarterly dividend and will mark the 14th consecutive annual dividend increase for Franco-Nevada shareholders.
In the first quarter of 2021, dividends declared were $0.26 per share. The total dividend declared was $49.9 million, of which $41.8 million was paid in cash and $8.1 million was paid in common shares under the Company’s Dividend Reinvestment Plan (“DRIP”).
F N V T S X N Y S E F r a n c o - N eva d a C o r p o r a t i o n14
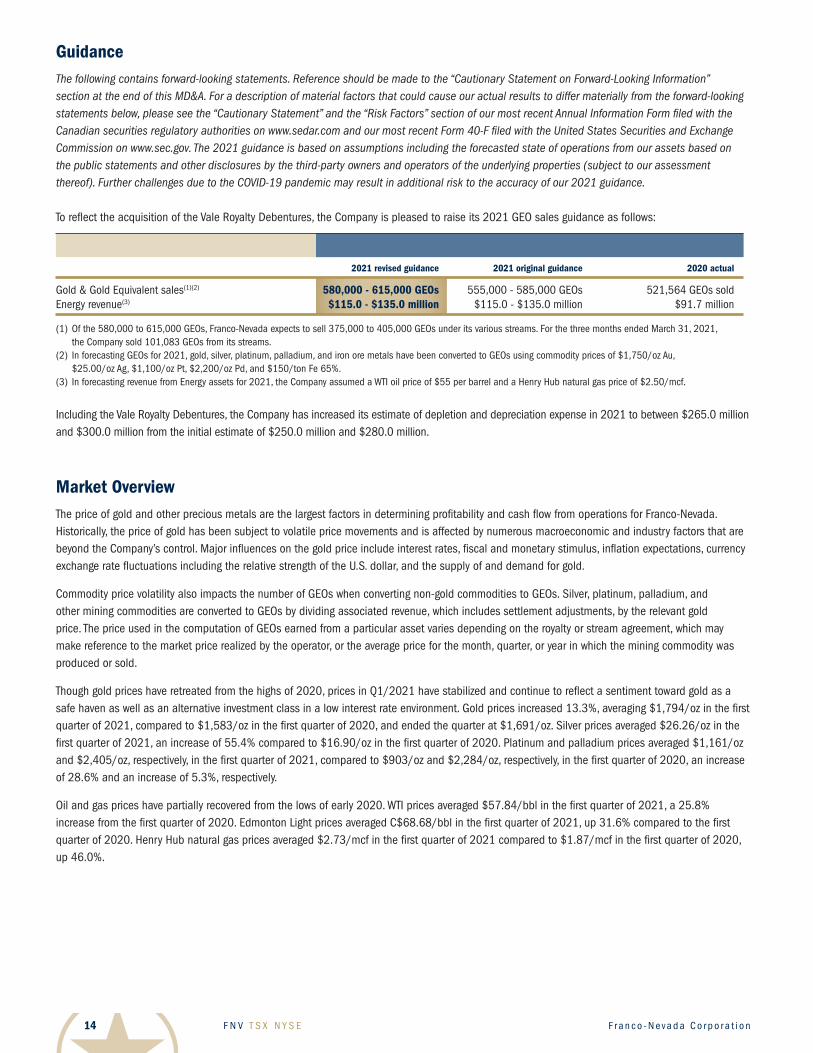
GuidanceThe following contains forward-looking statements. Reference should be made to the “Cautionary Statement on Forward-Looking Information” section at the end of this MD&A. For a description of material factors that could cause our actual results to differ materially from the forward-looking statements below, please see the “Cautionary Statement” and the “Risk Factors” section of our most recent Annual Information Form filed with the Canadian securities regulatory authorities on www.sedar.com and our most recent Form 40-F filed with the United States Securities and Exchange Commission on www.sec.gov. The 2021 guidance is based on assumptions including the forecasted state of operations from our assets based on the public statements and other disclosures by the third-party owners and operators of the underlying properties (subject to our assessment thereof). Further challenges due to the COVID-19 pandemic may result in additional risk to the accuracy of our 2021 guidance.
To reflect the acquisition of the Vale Royalty Debentures, the Company is pleased to raise its 2021 GEO sales guidance as follows:
2021 revised guidance 2021 original guidance 2020 actual
Gold & Gold Equivalent sales(1)(2) 580,000 - 615,000 GEOs 555,000 - 585,000 GEOs 521,564 GEOs soldEnergy revenue(3) $115.0 - $135.0 million $115.0 - $135.0 million $91.7 million
(1) Of the 580,000 to 615,000 GEOs, Franco-Nevada expects to sell 375,000 to 405,000 GEOs under its various streams. For the three months ended March 31, 2021, the Company sold 101,083 GEOs from its streams.
(2) In forecasting GEOs for 2021, gold, silver, platinum, palladium, and iron ore metals have been converted to GEOs using commodity prices of $1,750/oz Au, $25.00/oz Ag, $1,100/oz Pt, $2,200/oz Pd, and $150/ton Fe 65%.
(3) In forecasting revenue from Energy assets for 2021, the Company assumed a WTI oil price of $55 per barrel and a Henry Hub natural gas price of $2.50/mcf.
Including the Vale Royalty Debentures, the Company has increased its estimate of depletion and depreciation expense in 2021 to between $265.0 million and $300.0 million from the initial estimate of $250.0 million and $280.0 million.
Market OverviewThe price of gold and other precious metals are the largest factors in determining profitability and cash flow from operations for Franco-Nevada. Historically, the price of gold has been subject to volatile price movements and is affected by numerous macroeconomic and industry factors that are beyond the Company’s control. Major influences on the gold price include interest rates, fiscal and monetary stimulus, inflation expectations, currency exchange rate fluctuations including the relative strength of the U.S. dollar, and the supply of and demand for gold.
Commodity price volatility also impacts the number of GEOs when converting non-gold commodities to GEOs. Silver, platinum, palladium, and other mining commodities are converted to GEOs by dividing associated revenue, which includes settlement adjustments, by the relevant gold price. The price used in the computation of GEOs earned from a particular asset varies depending on the royalty or stream agreement, which may make reference to the market price realized by the operator, or the average price for the month, quarter, or year in which the mining commodity was produced or sold.
Though gold prices have retreated from the highs of 2020, prices in Q1/2021 have stabilized and continue to reflect a sentiment toward gold as a safe haven as well as an alternative investment class in a low interest rate environment. Gold prices increased 13.3%, averaging $1,794/oz in the first quarter of 2021, compared to $1,583/oz in the first quarter of 2020, and ended the quarter at $1,691/oz. Silver prices averaged $26.26/oz in the first quarter of 2021, an increase of 55.4% compared to $16.90/oz in the first quarter of 2020. Platinum and palladium prices averaged $1,161/oz and $2,405/oz, respectively, in the first quarter of 2021, compared to $903/oz and $2,284/oz, respectively, in the first quarter of 2020, an increase of 28.6% and an increase of 5.3%, respectively.
Oil and gas prices have partially recovered from the lows of early 2020. WTI prices averaged $57.84/bbl in the first quarter of 2021, a 25.8% increase from the first quarter of 2020. Edmonton Light prices averaged C$68.68/bbl in the first quarter of 2021, up 31.6% compared to the first quarter of 2020. Henry Hub natural gas prices averaged $2.73/mcf in the first quarter of 2021 compared to $1.87/mcf in the first quarter of 2020, up 46.0%.
2 0 2 1 F i r s t Q u a r t e r R e p o r t T h e G O L D I nve s t m e n t t h a t WO R K S 15
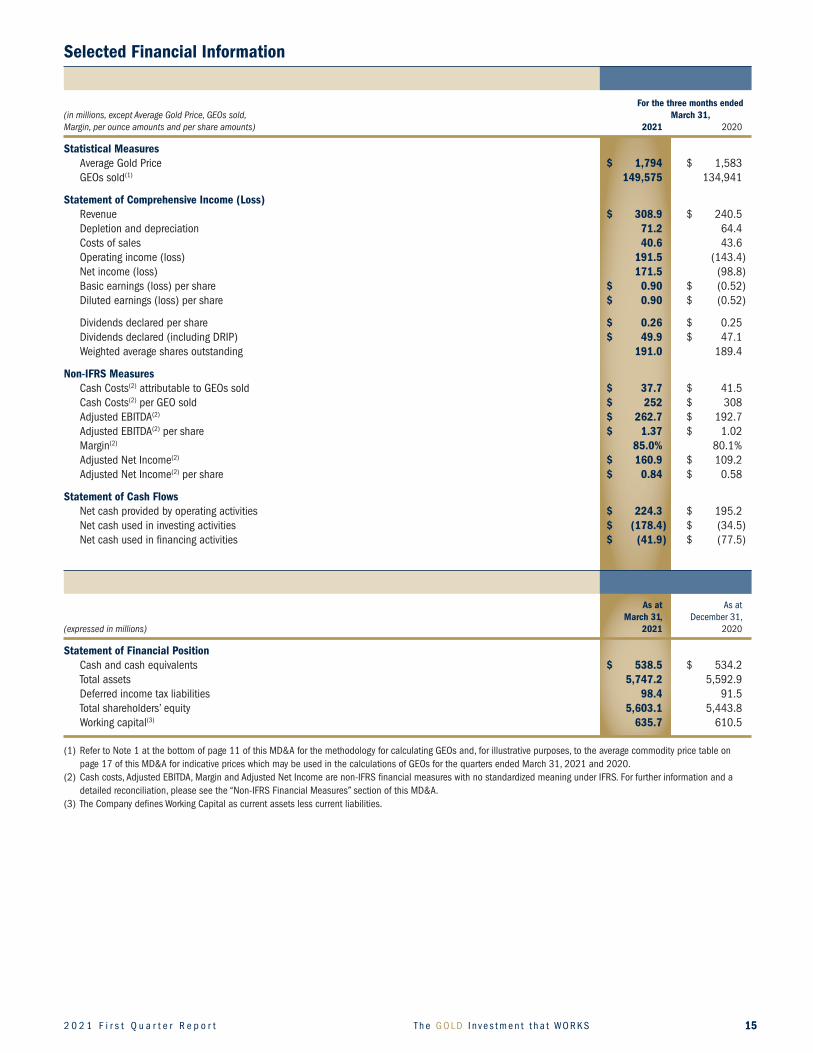
Selected Financial Information
For the three months ended(in millions, except Average Gold Price, GEOs sold, March 31, Margin, per ounce amounts and per share amounts) 2021 2020
Statistical Measures Average Gold Price $ 1,794 $ 1,583 GEOs sold(1) 149,575 134,941
StatementofComprehensiveIncome(Loss) Revenue $ 308.9 $ 240.5 Depletion and depreciation 71.2 64.4 Costs of sales 40.6 43.6 Operating income (loss) 191.5 (143.4 ) Net income (loss) 171.5 (98.8 ) Basic earnings (loss) per share $ 0.90 $ (0.52 ) Diluted earnings (loss) per share $ 0.90 $ (0.52 )
Dividends declared per share $ 0.26 $ 0.25 Dividends declared (including DRIP) $ 49.9 $ 47.1 Weighted average shares outstanding 191.0 189.4
Non-IFRS Measures Cash Costs(2) attributable to GEOs sold $ 37.7 $ 41.5 Cash Costs(2) per GEO sold $ 252 $ 308 Adjusted EBITDA(2) $ 262.7 $ 192.7 Adjusted EBITDA(2) per share $ 1.37 $ 1.02 Margin(2) 85.0% 80.1% Adjusted Net Income(2) $ 160.9 $ 109.2 Adjusted Net Income(2) per share $ 0.84 $ 0.58
Statement of Cash Flows Net cash provided by operating activities $ 224.3 $ 195.2 Net cash used in investing activities $ (178.4) $ (34.5 ) Net cash used in financing activities $ (41.9) $ (77.5 )
As at As at March 31, December 31, (expressed in millions) 2021 2020
Statement of Financial Position Cash and cash equivalents $ 538.5 $ 534.2 Total assets 5,747.2 5,592.9 Deferred income tax liabilities 98.4 91.5 Total shareholders’ equity 5,603.1 5,443.8 Working capital(3) 635.7 610.5 (1) Refer to Note 1 at the bottom of page 11 of this MD&A for the methodology for calculating GEOs and, for illustrative purposes, to the average commodity price table on
page 17 of this MD&A for indicative prices which may be used in the calculations of GEOs for the quarters ended March 31, 2021 and 2020.(2) Cash costs, Adjusted EBITDA, Margin and Adjusted Net Income are non-IFRS financial measures with no standardized meaning under IFRS. For further information and a
detailed reconciliation, please see the “Non-IFRS Financial Measures” section of this MD&A. (3) The Company defines Working Capital as current assets less current liabilities.
F N V T S X N Y S E F r a n c o - N eva d a C o r p o r a t i o n16
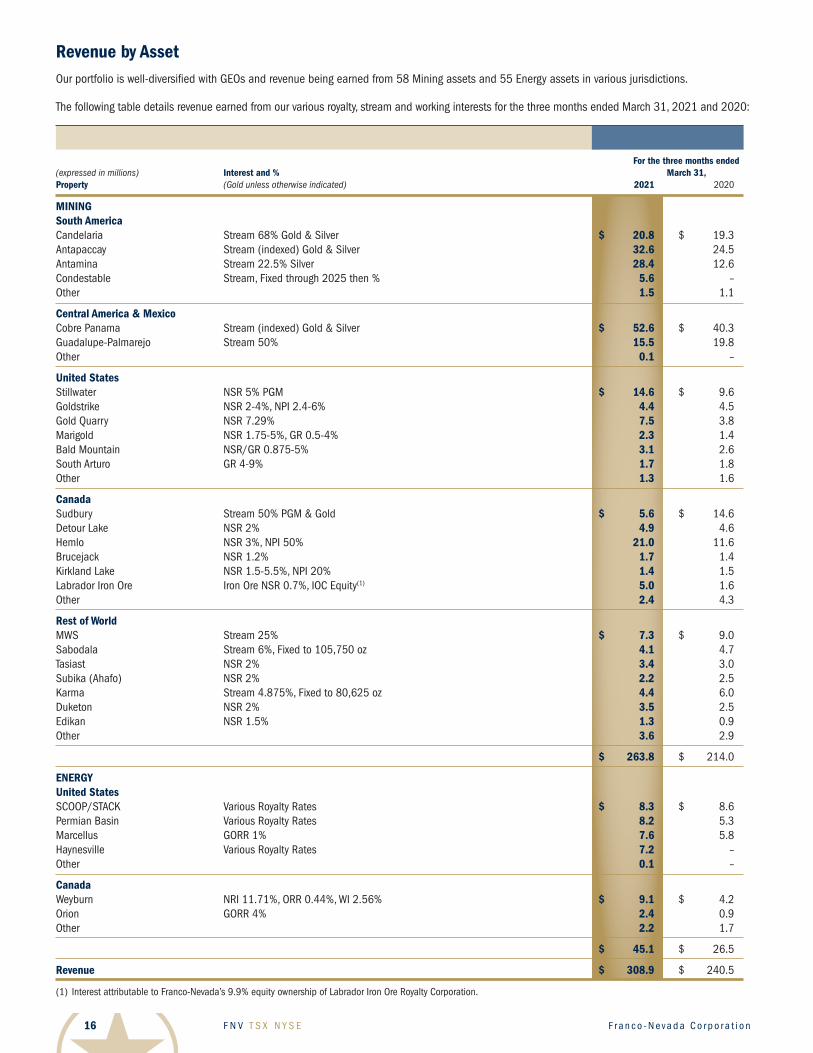
Revenue by AssetOur portfolio is well-diversified with GEOs and revenue being earned from 58 Mining assets and 55 Energy assets in various jurisdictions.
The following table details revenue earned from our various royalty, stream and working interests for the three months ended March 31, 2021 and 2020:
For the three months ended (expressed in millions) Interest and % March 31, Property (Gold unless otherwise indicated) 2021 2020
MININGSouth AmericaCandelaria Stream 68% Gold & Silver $ 20.8 $ 19.3Antapaccay Stream (indexed) Gold & Silver 32.6 24.5Antamina Stream 22.5% Silver 28.4 12.6Condestable Stream, Fixed through 2025 then % 5.6 –Other 1.5 1.1
Central America & Mexico Cobre Panama Stream (indexed) Gold & Silver $ 52.6 $ 40.3Guadalupe-Palmarejo Stream 50% 15.5 19.8Other 0.1 –
United States Stillwater NSR 5% PGM $ 14.6 $ 9.6Goldstrike NSR 2-4%, NPI 2.4-6% 4.4 4.5Gold Quarry NSR 7.29% 7.5 3.8Marigold NSR 1.75-5%, GR 0.5-4% 2.3 1.4Bald Mountain NSR/GR 0.875-5% 3.1 2.6South Arturo GR 4-9% 1.7 1.8Other 1.3 1.6
Canada Sudbury Stream 50% PGM & Gold $ 5.6 $ 14.6Detour Lake NSR 2% 4.9 4.6Hemlo NSR 3%, NPI 50% 21.0 11.6Brucejack NSR 1.2% 1.7 1.4Kirkland Lake NSR 1.5-5.5%, NPI 20% 1.4 1.5Labrador Iron Ore Iron Ore NSR 0.7%, IOC Equity(1) 5.0 1.6Other 2.4 4.3
Rest of World MWS Stream 25% $ 7.3 $ 9.0Sabodala Stream 6%, Fixed to 105,750 oz 4.1 4.7Tasiast NSR 2% 3.4 3.0Subika (Ahafo) NSR 2% 2.2 2.5Karma Stream 4.875%, Fixed to 80,625 oz 4.4 6.0Duketon NSR 2% 3.5 2.5Edikan NSR 1.5% 1.3 0.9Other 3.6 2.9
$ 263.8 $ 214.0
ENERGY United States SCOOP/STACK Various Royalty Rates $ 8.3 $ 8.6Permian Basin Various Royalty Rates 8.2 5.3Marcellus GORR 1% 7.6 5.8Haynesville Various Royalty Rates 7.2 –Other 0.1 –
Canada Weyburn NRI 11.71%, ORR 0.44%, WI 2.56% $ 9.1 $ 4.2Orion GORR 4% 2.4 0.9Other 2.2 1.7
$ 45.1 $ 26.5
Revenue $ 308.9 $ 240.5
(1) Interest attributable to Franco-Nevada’s 9.9% equity ownership of Labrador Iron Ore Royalty Corporation.
2 0 2 1 F i r s t Q u a r t e r R e p o r t T h e G O L D I nve s t m e n t t h a t WO R K S 17
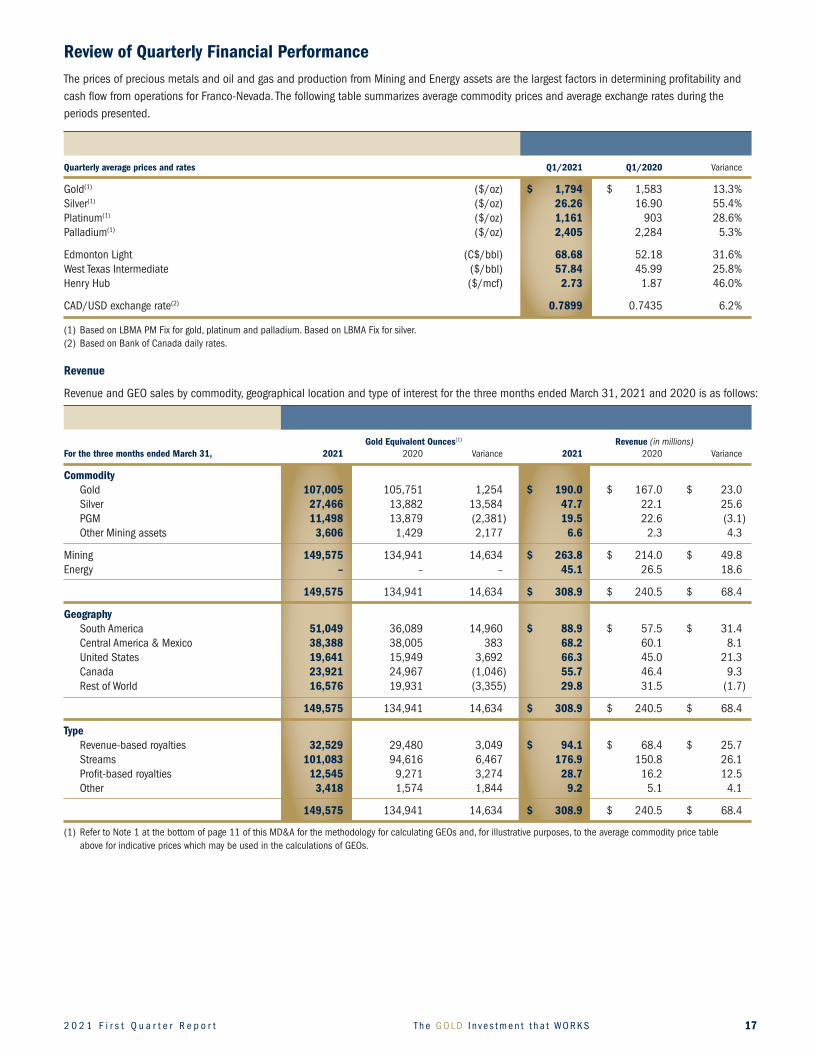
Review of Quarterly Financial Performance The prices of precious metals and oil and gas and production from Mining and Energy assets are the largest factors in determining profitability and cash flow from operations for Franco-Nevada. The following table summarizes average commodity prices and average exchange rates during the periods presented.
Quarterly average prices and rates Q1/2021 Q1/2020 Variance
Gold(1) ($/oz) $ 1,794 $ 1,583 13.3% Silver(1) ($/oz) 26.26 16.90 55.4% Platinum(1) ($/oz) 1,161 903 28.6% Palladium(1) ($/oz) 2,405 2,284 5.3%
Edmonton Light (C$/bbl) 68.68 52.18 31.6% West Texas Intermediate ($/bbl) 57.84 45.99 25.8% Henry Hub ($/mcf) 2.73 1.87 46.0%
CAD/USD exchange rate(2) 0.7899 0.7435 6.2%
(1) Based on LBMA PM Fix for gold, platinum and palladium. Based on LBMA Fix for silver.(2) Based on Bank of Canada daily rates.
Revenue
Revenue and GEO sales by commodity, geographical location and type of interest for the three months ended March 31, 2021 and 2020 is as follows:
Gold Equivalent Ounces(1) Revenue (in millions) For the three months ended March 31, 2021 2020 Variance 2021 2020 Variance
Commodity Gold 107,005 105,751 1,254 $ 190.0 $ 167.0 $ 23.0 Silver 27,466 13,882 13,584 47.7 22.1 25.6 PGM 11,498 13,879 (2,381 ) 19.5 22.6 (3.1 ) Other Mining assets 3,606 1,429 2,177 6.6 2.3 4.3
Mining 149,575 134,941 14,634 $ 263.8 $ 214.0 $ 49.8Energy – – – 45.1 26.5 18.6
149,575 134,941 14,634 $ 308.9 $ 240.5 $ 68.4
Geography South America 51,049 36,089 14,960 $ 88.9 $ 57.5 $ 31.4 Central America & Mexico 38,388 38,005 383 68.2 60.1 8.1 United States 19,641 15,949 3,692 66.3 45.0 21.3 Canada 23,921 24,967 (1,046 ) 55.7 46.4 9.3 Rest of World 16,576 19,931 (3,355 ) 29.8 31.5 (1.7 )
149,575 134,941 14,634 $ 308.9 $ 240.5 $ 68.4
Type Revenue-based royalties 32,529 29,480 3,049 $ 94.1 $ 68.4 $ 25.7 Streams 101,083 94,616 6,467 176.9 150.8 26.1 Profit-based royalties 12,545 9,271 3,274 28.7 16.2 12.5 Other 3,418 1,574 1,844 9.2 5.1 4.1
149,575 134,941 14,634 $ 308.9 $ 240.5 $ 68.4
(1) Refer to Note 1 at the bottom of page 11 of this MD&A for the methodology for calculating GEOs and, for illustrative purposes, to the average commodity price table above for indicative prices which may be used in the calculations of GEOs.
F N V T S X N Y S E F r a n c o - N eva d a C o r p o r a t i o n18
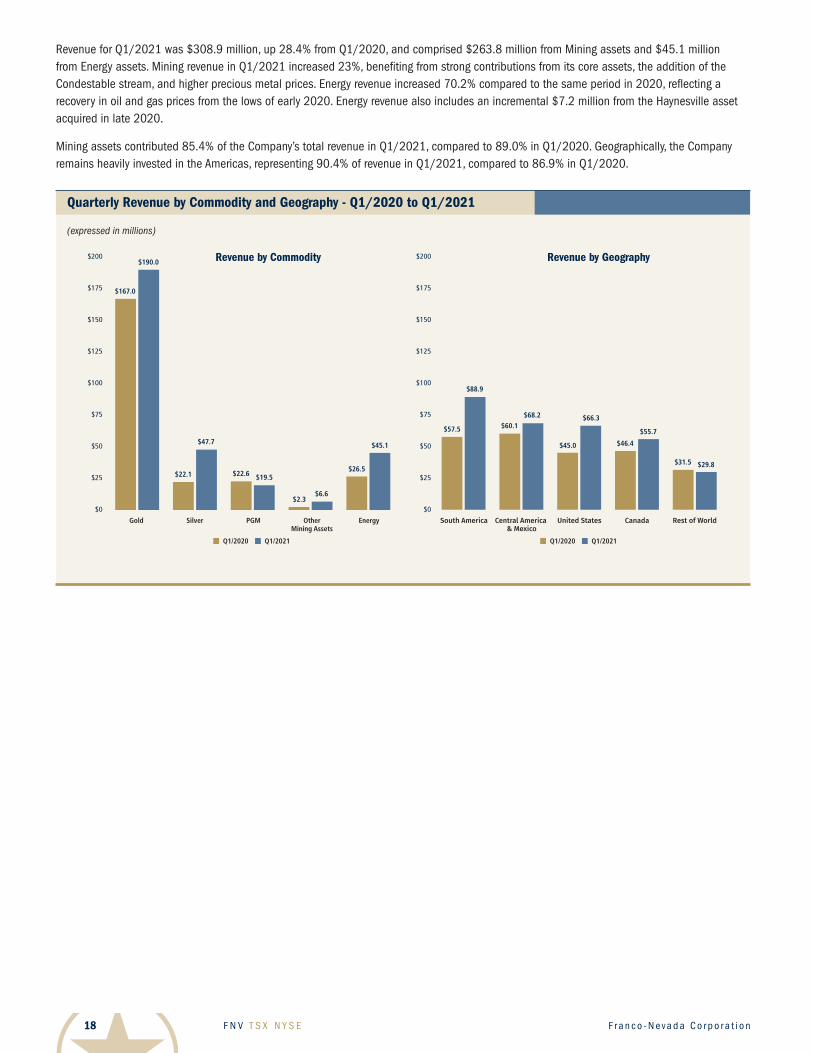
Revenue for Q1/2021 was $308.9 million, up 28.4% from Q1/2020, and comprised $263.8 million from Mining assets and $45.1 million from Energy assets. Mining revenue in Q1/2021 increased 23%, benefiting from strong contributions from its core assets, the addition of the Condestable stream, and higher precious metal prices. Energy revenue increased 70.2% compared to the same period in 2020, reflecting a recovery in oil and gas prices from the lows of early 2020. Energy revenue also includes an incremental $7.2 million from the Haynesville asset acquired in late 2020.
Mining assets contributed 85.4% of the Company’s total revenue in Q1/2021, compared to 89.0% in Q1/2020. Geographically, the Company remains heavily invested in the Americas, representing 90.4% of revenue in Q1/2021, compared to 86.9% in Q1/2020.
Quarterly Revenue by Commodity and Geography - Q1/2020 to Q1/2021
(expressed in millions)
Revenue by Commodity Revenue by Geography
Q1/2020 Q1/2021 Q1/2020 Q1/2021
Gold Silver PGM OtherMining Assets
Energy
$200
$175
$150
$125
$100
$75
$50
$25
$0
$200
$175
$150
$125
$100
$75
$50
$25
$0
South America United StatesCentral America & Mexico
Canada Rest of World
$47.7
$22.1
$190.0
$167.0
$19.5$22.6
$6.6$2.3
$45.1
$26.5
$55.7
$46.4
$29.8$31.5
$88.9
$57.5
$68.2$60.1
$66.3
$45.0
Q1_graphs D+E_Quarterly Revenue by Commodity and Geography - Q1/2020 to Q1/2021_q1’21
2 0 2 1 F i r s t Q u a r t e r R e p o r t T h e G O L D I nve s t m e n t t h a t WO R K S 19
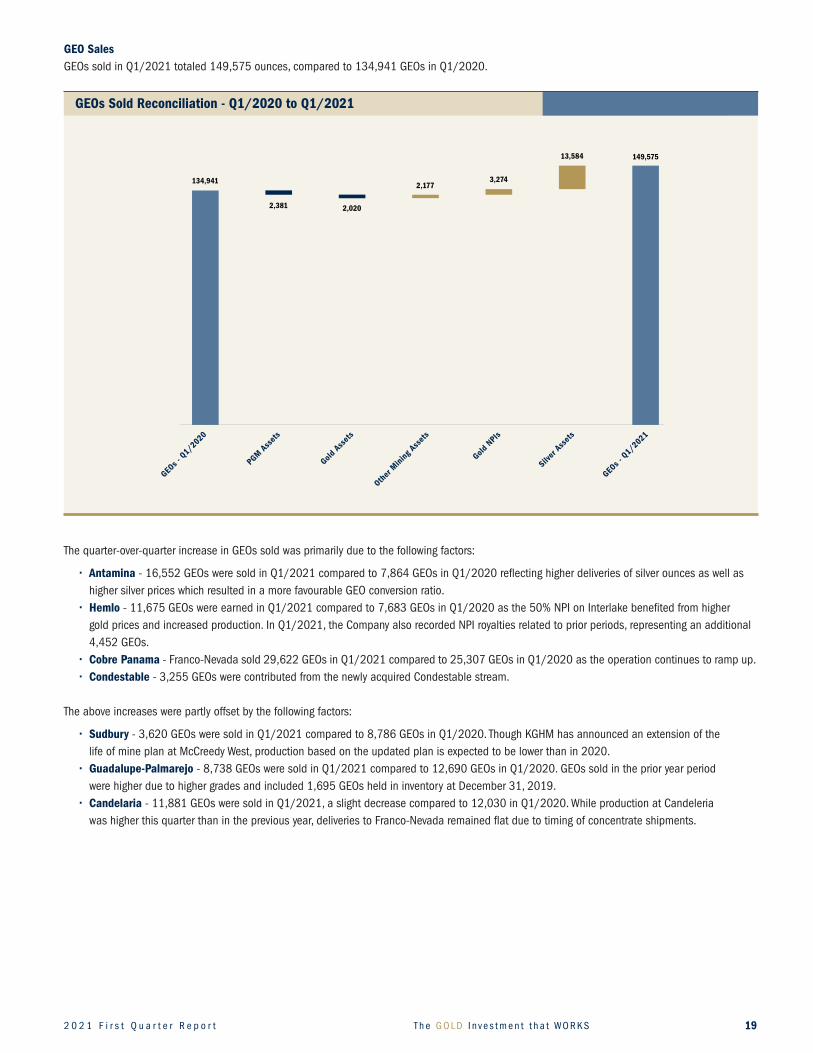
GEO SalesGEOs sold in Q1/2021 totaled 149,575 ounces, compared to 134,941 GEOs in Q1/2020.
The quarter-over-quarter increase in GEOs sold was primarily due to the following factors:
• Antamina - 16,552 GEOs were sold in Q1/2021 compared to 7,864 GEOs in Q1/2020 reflecting higher deliveries of silver ounces as well as higher silver prices which resulted in a more favourable GEO conversion ratio.
• Hemlo - 11,675 GEOs were earned in Q1/2021 compared to 7,683 GEOs in Q1/2020 as the 50% NPI on Interlake benefited from higher gold prices and increased production. In Q1/2021, the Company also recorded NPI royalties related to prior periods, representing an additional 4,452 GEOs.
• CobrePanama - Franco-Nevada sold 29,622 GEOs in Q1/2021 compared to 25,307 GEOs in Q1/2020 as the operation continues to ramp up.• Condestable - 3,255 GEOs were contributed from the newly acquired Condestable stream.
The above increases were partly offset by the following factors:
• Sudbury - 3,620 GEOs were sold in Q1/2021 compared to 8,786 GEOs in Q1/2020. Though KGHM has announced an extension of the life of mine plan at McCreedy West, production based on the updated plan is expected to be lower than in 2020.
• Guadalupe-Palmarejo - 8,738 GEOs were sold in Q1/2021 compared to 12,690 GEOs in Q1/2020. GEOs sold in the prior year period were higher due to higher grades and included 1,695 GEOs held in inventory at December 31, 2019.
• Candelaria - 11,881 GEOs were sold in Q1/2021, a slight decrease compared to 12,030 in Q1/2020. While production at Candeleria was higher this quarter than in the previous year, deliveries to Franco-Nevada remained flat due to timing of concentrate shipments.
GEOs Sold Reconciliation - Q1/2020 to Q1/2021
GEOs -
Q1/2020
PGM Ass
ets
Gold A
sset
s
Other
Mini
ng A
sset
s
Gold N
PIs
GEOs -
Q1/2021
Silver
Ass
ets
graph F_GEO Sales - Q1/2020 to Q1/2021_q1’21
149,575
2,381 2,020
2,177 3,274
13,584
134,941
F N V T S X N Y S E F r a n c o - N eva d a C o r p o r a t i o n20
Energy Revenue
Energy assets earned revenue of $45.1 million (57.5% oil, 32.1% gas and 10.4% NGLs) for the quarter, an increase of 70.2% compared to $26.5 million (64.8% oil, 22.1% gas and 13.1% NGLs) in Q1/2020. U.S. assets generated 69.6% of Franco-Nevada’s Energy revenue. The increase in Energy revenue was primarily due to a recovery in oil and gas prices relative to the prior period, as well as the acquisition of the Haynesville asset in late 2020:
• Weyburn - Revenue from the Weyburn Unit was $9.1 million in Q1/2021 compared to $4.2 million in Q1/2020 due mostly to higher revenue from the NRI as a result of increased realized oil prices. The realized oil price was C$63.06/boe compared to C$46.05/boe for Q1/2020.
• Permian - Royalties from the Permian contributed $8.2 million in Q1/2021 compared to $5.3 million in Q1/2020 due to higher volumes and realized commodity prices.
• Haynesville - The newly acquired portfolio of royalties contributed an incremental $7.2 million in Q1/2021.
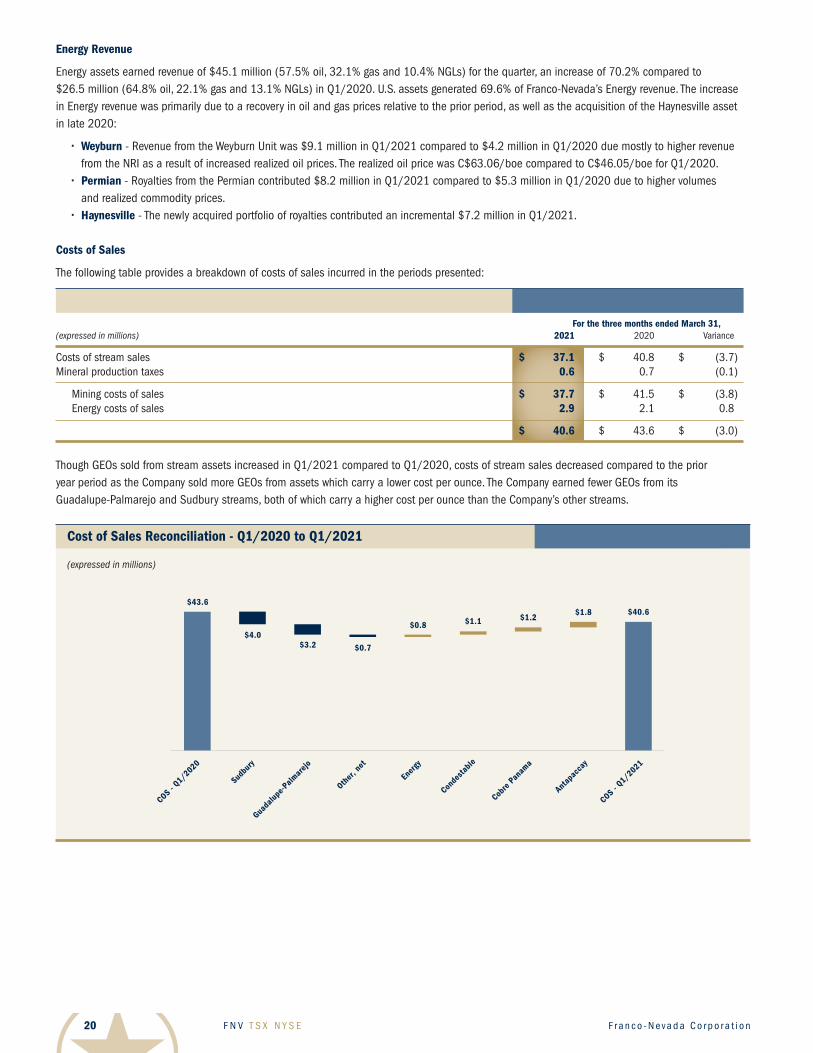
Costs of Sales
The following table provides a breakdown of costs of sales incurred in the periods presented:
For the three months ended March 31,(expressed in millions) 2021 2020 Variance
Costs of stream sales $ 37.1 $ 40.8 $ (3.7 )Mineral production taxes 0.6 0.7 (0.1 )
Mining costs of sales $ 37.7 $ 41.5 $ (3.8 ) Energy costs of sales 2.9 2.1 0.8
$ 40.6 $ 43.6 $ (3.0 )
Though GEOs sold from stream assets increased in Q1/2021 compared to Q1/2020, costs of stream sales decreased compared to the prior year period as the Company sold more GEOs from assets which carry a lower cost per ounce. The Company earned fewer GEOs from its Guadalupe-Palmarejo and Sudbury streams, both of which carry a higher cost per ounce than the Company’s other streams.
Cost of Sales Reconciliation - Q1/2020 to Q1/2021
(expressed in millions)
Cobre
Pan
ama
COS - Q1/2020
Sudbu
ry
Conde
stable
Antap
acca
y
COS - Q1/2021
Ener
gy
Guada
lupe-P
almar
ejo
Other
, net
graph G_Costs of Sales Reconciliation - Q1/2020 to Q1/2021_q1’21
$40.6
$4.0$3.2 $0.7
$0.8 $1.1 $1.2$1.8
$43.6
2 0 2 1 F i r s t Q u a r t e r R e p o r t T h e G O L D I nve s t m e n t t h a t WO R K S 21
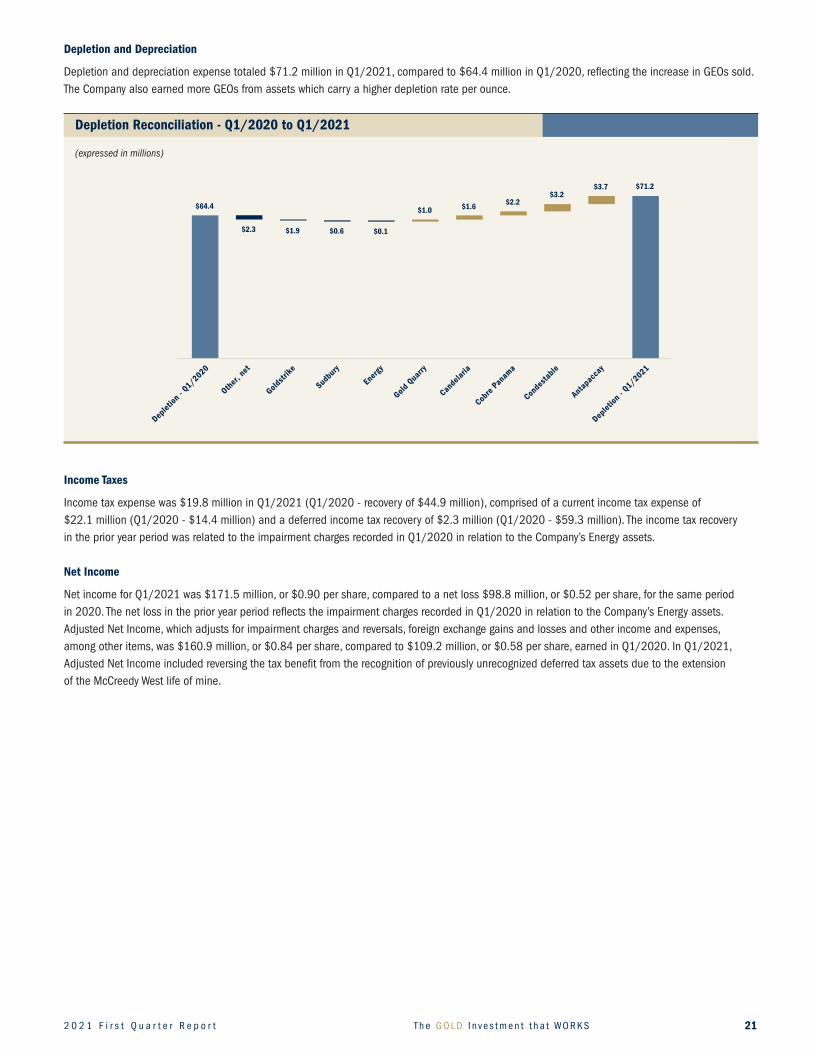
Depletion and Depreciation
Depletion and depreciation expense totaled $71.2 million in Q1/2021, compared to $64.4 million in Q1/2020, reflecting the increase in GEOs sold. The Company also earned more GEOs from assets which carry a higher depletion rate per ounce.
IncomeTaxes
Income tax expense was $19.8 million in Q1/2021 (Q1/2020 - recovery of $44.9 million), comprised of a current income tax expense of $22.1 million (Q1/2020 - $14.4 million) and a deferred income tax recovery of $2.3 million (Q1/2020 - $59.3 million). The income tax recovery in the prior year period was related to the impairment charges recorded in Q1/2020 in relation to the Company’s Energy assets.
Net Income
Net income for Q1/2021 was $171.5 million, or $0.90 per share, compared to a net loss $98.8 million, or $0.52 per share, for the same period in 2020. The net loss in the prior year period reflects the impairment charges recorded in Q1/2020 in relation to the Company’s Energy assets. Adjusted Net Income, which adjusts for impairment charges and reversals, foreign exchange gains and losses and other income and expenses, among other items, was $160.9 million, or $0.84 per share, compared to $109.2 million, or $0.58 per share, earned in Q1/2020. In Q1/2021, Adjusted Net Income included reversing the tax benefit from the recognition of previously unrecognized deferred tax assets due to the extension of the McCreedy West life of mine.
Depletion Reconciliation - Q1/2020 to Q1/2021
(expressed in millions)
Deplet
ion -
Q1/2020
Goldstr
ike
Conde
stable
Cande
laria
Gold Q
uarry
Other
, net
Sudbu
ry
Ener
gy
Antap
acca
y
Deplet
ion -
Q1/2021
graph H_Depletion Reconciliation – Q1/2020 to Q1/2021_q1’21
Cobre
Pan
ama
$71.2
$2.3 $1.9 $0.6 $0.1
$1.0 $1.6 $2.2
$3.7
$64.4 $3.2
F N V T S X N Y S E F r a n c o - N eva d a C o r p o r a t i o n22
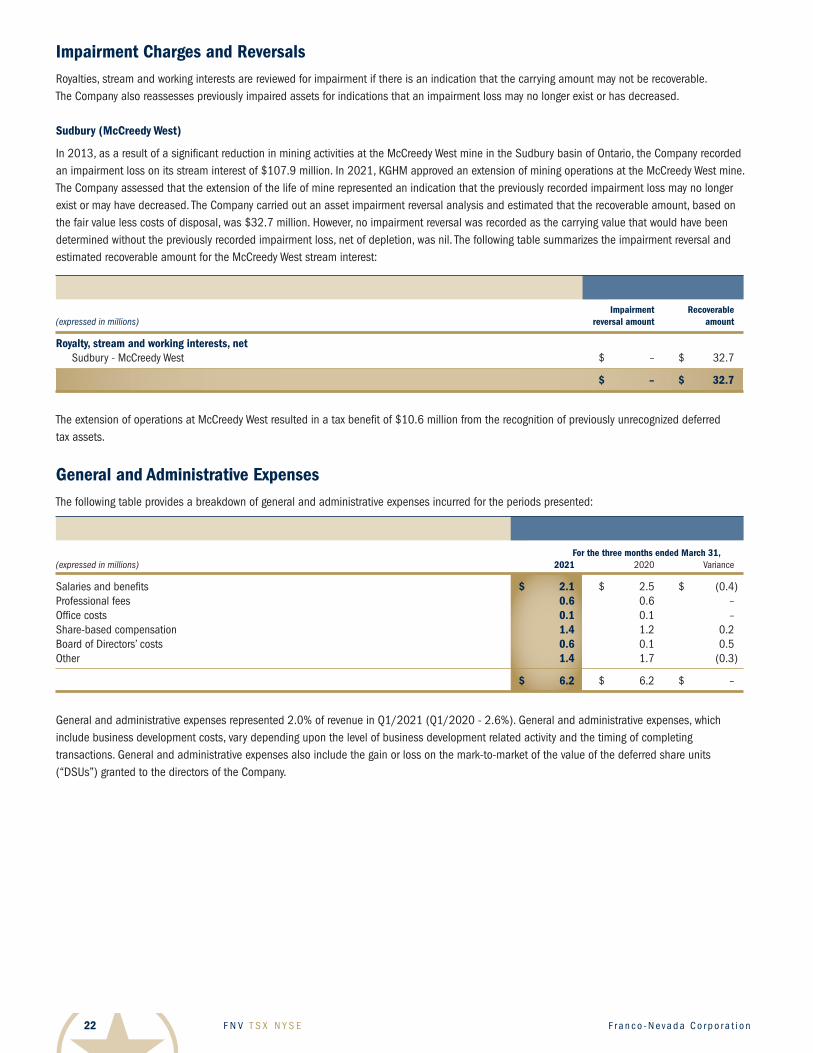
Impairment Charges and Reversals Royalties, stream and working interests are reviewed for impairment if there is an indication that the carrying amount may not be recoverable. The Company also reassesses previously impaired assets for indications that an impairment loss may no longer exist or has decreased.
Sudbury(McCreedyWest)
In 2013, as a result of a significant reduction in mining activities at the McCreedy West mine in the Sudbury basin of Ontario, the Company recorded an impairment loss on its stream interest of $107.9 million. In 2021, KGHM approved an extension of mining operations at the McCreedy West mine. The Company assessed that the extension of the life of mine represented an indication that the previously recorded impairment loss may no longer exist or may have decreased. The Company carried out an asset impairment reversal analysis and estimated that the recoverable amount, based on the fair value less costs of disposal, was $32.7 million. However, no impairment reversal was recorded as the carrying value that would have been determined without the previously recorded impairment loss, net of depletion, was nil. The following table summarizes the impairment reversal and estimated recoverable amount for the McCreedy West stream interest:
Impairment Recoverable (expressed in millions) reversal amount amount
Royalty, stream and working interests, net Sudbury - McCreedy West $ – $ 32.7
$ – $ 32.7
The extension of operations at McCreedy West resulted in a tax benefit of $10.6 million from the recognition of previously unrecognized deferred tax assets.
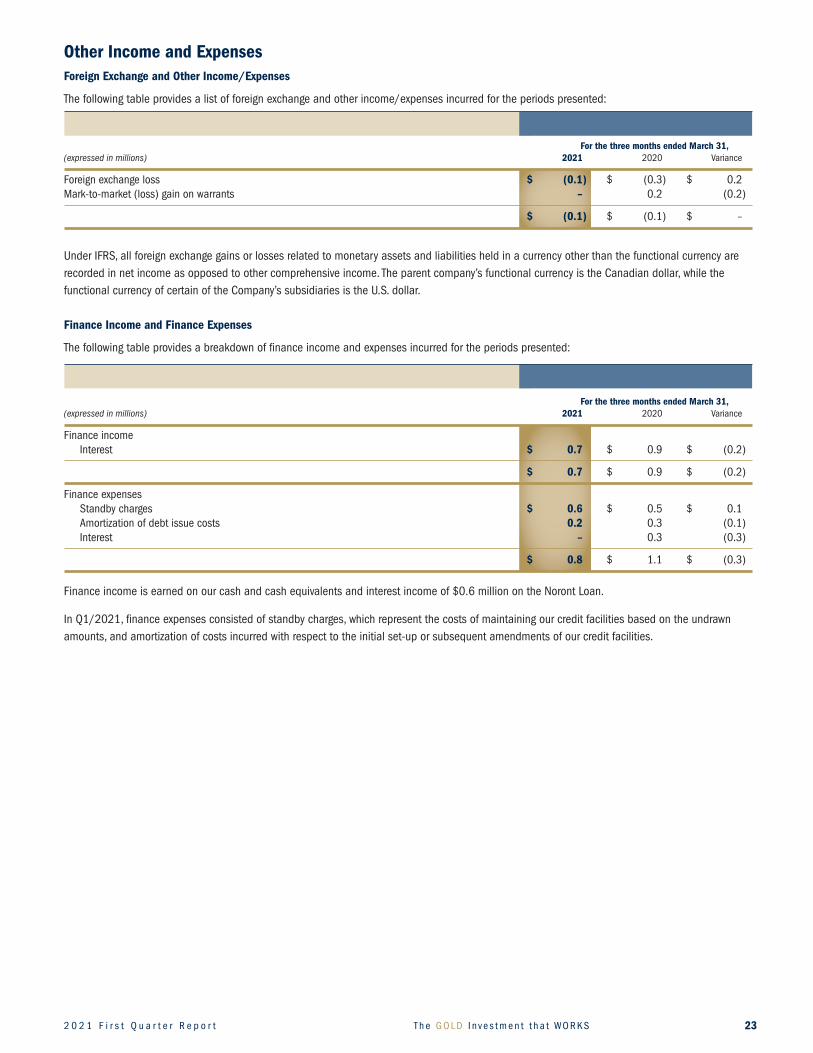
General and Administrative ExpensesThe following table provides a breakdown of general and administrative expenses incurred for the periods presented:
For the three months ended March 31, (expressed in millions) 2021 2020 Variance
Salaries and benefits $ 2.1 $ 2.5 $ (0.4 )Professional fees 0.6 0.6 –Office costs 0.1 0.1 –Share-based compensation 1.4 1.2 0.2Board of Directors’ costs 0.6 0.1 0.5Other 1.4 1.7 (0.3 )
$ 6.2 $ 6.2 $ –
General and administrative expenses represented 2.0% of revenue in Q1/2021 (Q1/2020 - 2.6%). General and administrative expenses, which include business development costs, vary depending upon the level of business development related activity and the timing of completing transactions. General and administrative expenses also include the gain or loss on the mark-to-market of the value of the deferred share units (“DSUs”) granted to the directors of the Company.
2 0 2 1 F i r s t Q u a r t e r R e p o r t T h e G O L D I nve s t m e n t t h a t WO R K S 23
Other Income and ExpensesForeign Exchange and Other Income/Expenses
The following table provides a list of foreign exchange and other income/expenses incurred for the periods presented:
For the three months ended March 31, (expressed in millions) 2021 2020 Variance
Foreign exchange loss $ (0.1) $ (0.3 ) $ 0.2Mark-to-market (loss) gain on warrants – 0.2 (0.2 )
$ (0.1) $ (0.1 ) $ –
Under IFRS, all foreign exchange gains or losses related to monetary assets and liabilities held in a currency other than the functional currency are recorded in net income as opposed to other comprehensive income. The parent company’s functional currency is the Canadian dollar, while the functional currency of certain of the Company’s subsidiaries is the U.S. dollar.
Finance Income and Finance Expenses
The following table provides a breakdown of finance income and expenses incurred for the periods presented:
For the three months ended March 31, (expressed in millions) 2021 2020 Variance
Finance income Interest $ 0.7 $ 0.9 $ (0.2 )
$ 0.7 $ 0.9 $ (0.2 )
Finance expenses Standby charges $ 0.6 $ 0.5 $ 0.1 Amortization of debt issue costs 0.2 0.3 (0.1 ) Interest – 0.3 (0.3 )
$ 0.8 $ 1.1 $ (0.3 )
Finance income is earned on our cash and cash equivalents and interest income of $0.6 million on the Noront Loan.
In Q1/2021, finance expenses consisted of standby charges, which represent the costs of maintaining our credit facilities based on the undrawn amounts, and amortization of costs incurred with respect to the initial set-up or subsequent amendments of our credit facilities.
F N V T S X N Y S E F r a n c o - N eva d a C o r p o r a t i o n24
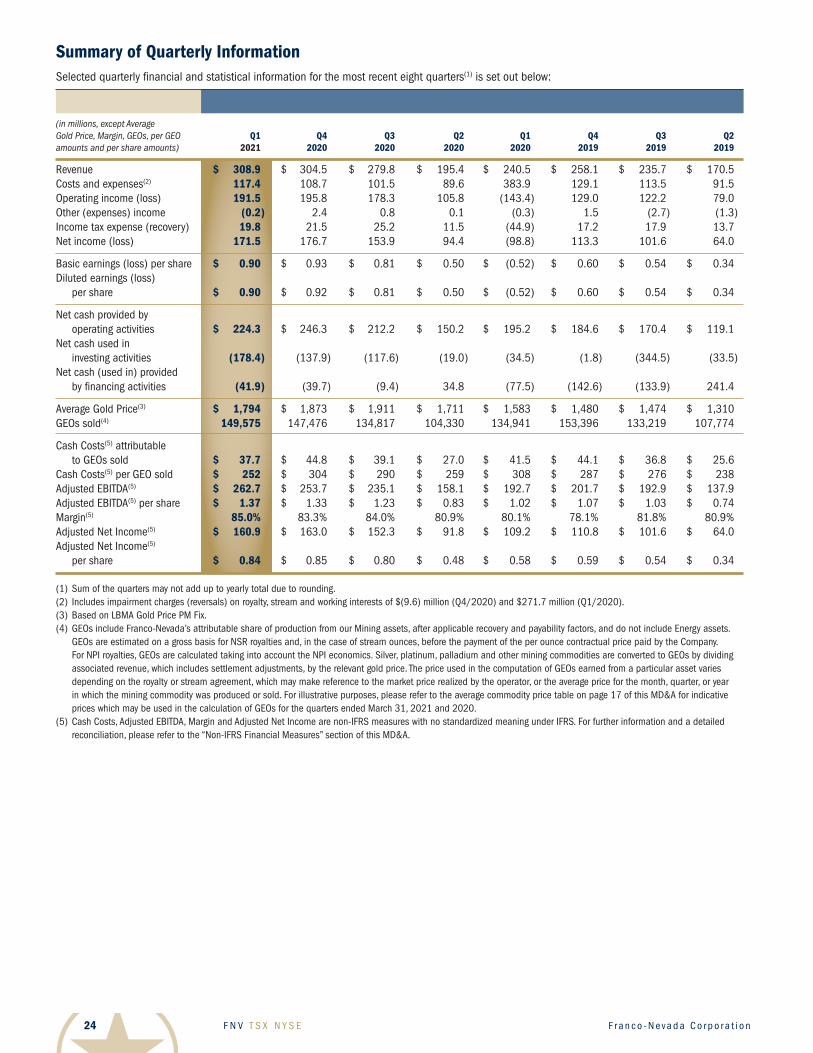
Summary of Quarterly InformationSelected quarterly financial and statistical information for the most recent eight quarters(1) is set out below:
(in millions, except Average Gold Price, Margin, GEOs, per GEO Q1 Q4 Q3 Q2 Q1 Q4 Q3 Q2 amounts and per share amounts) 2021 2020 2020 2020 2020 2019 2019 2019
Revenue $ 308.9 $ 304.5 $ 279.8 $ 195.4 $ 240.5 $ 258.1 $ 235.7 $ 170.5Costs and expenses(2) 117.4 108.7 101.5 89.6 383.9 129.1 113.5 91.5Operating income (loss) 191.5 195.8 178.3 105.8 (143.4 ) 129.0 122.2 79.0Other (expenses) income (0.2) 2.4 0.8 0.1 (0.3 ) 1.5 (2.7 ) (1.3 )Income tax expense (recovery) 19.8 21.5 25.2 11.5 (44.9 ) 17.2 17.9 13.7Net income (loss) 171.5 176.7 153.9 94.4 (98.8 ) 113.3 101.6 64.0
Basic earnings (loss) per share $ 0.90 $ 0.93 $ 0.81 $ 0.50 $ (0.52 ) $ 0.60 $ 0.54 $ 0.34Diluted earnings (loss) per share $ 0.90 $ 0.92 $ 0.81 $ 0.50 $ (0.52 ) $ 0.60 $ 0.54 $ 0.34
Net cash provided by operating activities $ 224.3 $ 246.3 $ 212.2 $ 150.2 $ 195.2 $ 184.6 $ 170.4 $ 119.1Net cash used in investing activities (178.4) (137.9 ) (117.6 ) (19.0 ) (34.5 ) (1.8 ) (344.5 ) (33.5 )Net cash (used in) provided by financing activities (41.9) (39.7 ) (9.4 ) 34.8 (77.5 ) (142.6 ) (133.9 ) 241.4
Average Gold Price(3) $ 1,794 $ 1,873 $ 1,911 $ 1,711 $ 1,583 $ 1,480 $ 1,474 $ 1,310GEOs sold(4) 149,575 147,476 134,817 104,330 134,941 153,396 133,219 107,774
Cash Costs(5) attributable to GEOs sold $ 37.7 $ 44.8 $ 39.1 $ 27.0 $ 41.5 $ 44.1 $ 36.8 $ 25.6Cash Costs(5) per GEO sold $ 252 $ 304 $ 290 $ 259 $ 308 $ 287 $ 276 $ 238Adjusted EBITDA(5) $ 262.7 $ 253.7 $ 235.1 $ 158.1 $ 192.7 $ 201.7 $ 192.9 $ 137.9Adjusted EBITDA(5) per share $ 1.37 $ 1.33 $ 1.23 $ 0.83 $ 1.02 $ 1.07 $ 1.03 $ 0.74Margin(5) 85.0% 83.3% 84.0% 80.9% 80.1% 78.1% 81.8% 80.9%Adjusted Net Income(5) $ 160.9 $ 163.0 $ 152.3 $ 91.8 $ 109.2 $ 110.8 $ 101.6 $ 64.0Adjusted Net Income(5) per share $ 0.84 $ 0.85 $ 0.80 $ 0.48 $ 0.58 $ 0.59 $ 0.54 $ 0.34 (1) Sum of the quarters may not add up to yearly total due to rounding.(2) Includes impairment charges (reversals) on royalty, stream and working interests of $(9.6) million (Q4/2020) and $271.7 million (Q1/2020).(3) Based on LBMA Gold Price PM Fix. (4) GEOs include Franco-Nevada’s attributable share of production from our Mining assets, after applicable recovery and payability factors, and do not include Energy assets.
GEOs are estimated on a gross basis for NSR royalties and, in the case of stream ounces, before the payment of the per ounce contractual price paid by the Company. For NPI royalties, GEOs are calculated taking into account the NPI economics. Silver, platinum, palladium and other mining commodities are converted to GEOs by dividing associated revenue, which includes settlement adjustments, by the relevant gold price. The price used in the computation of GEOs earned from a particular asset varies depending on the royalty or stream agreement, which may make reference to the market price realized by the operator, or the average price for the month, quarter, or year in which the mining commodity was produced or sold. For illustrative purposes, please refer to the average commodity price table on page 17 of this MD&A for indicative prices which may be used in the calculation of GEOs for the quarters ended March 31, 2021 and 2020.
(5) Cash Costs, Adjusted EBITDA, Margin and Adjusted Net Income are non-IFRS measures with no standardized meaning under IFRS. For further information and a detailed reconciliation, please refer to the “Non-IFRS Financial Measures” section of this MD&A.
2 0 2 1 F i r s t Q u a r t e r R e p o r t T h e G O L D I nve s t m e n t t h a t WO R K S 25
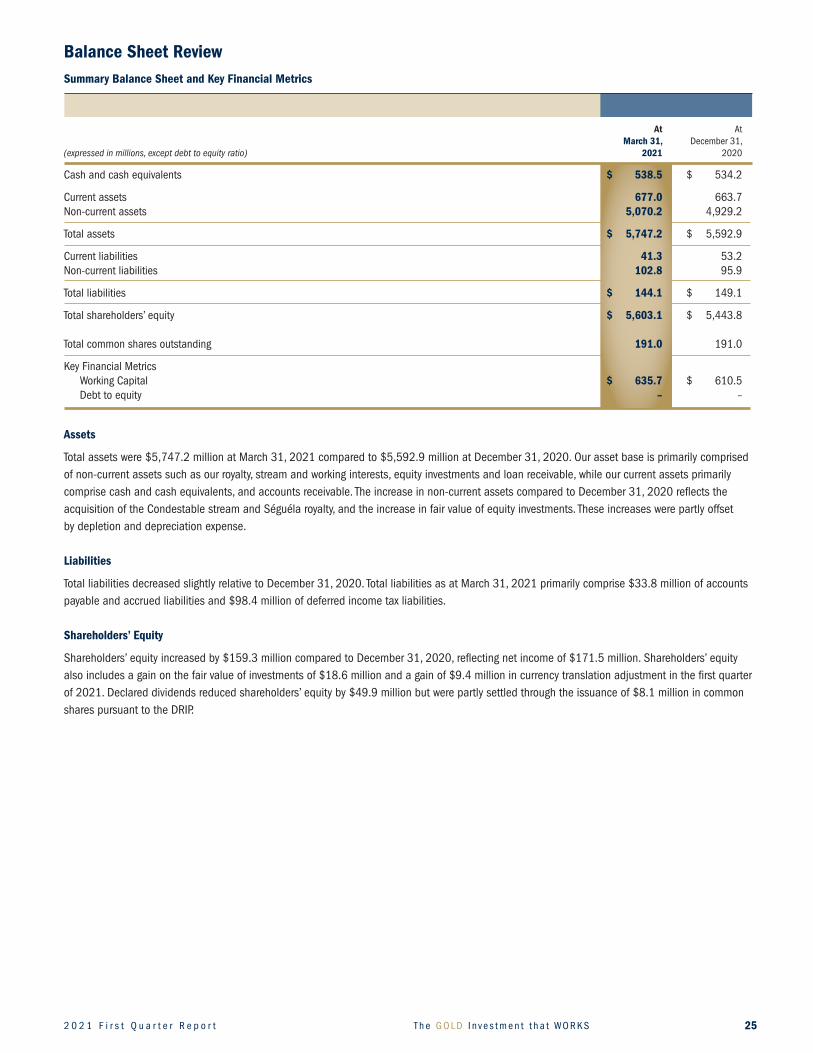
BalanceSheetReviewSummaryBalanceSheetandKeyFinancialMetrics
At At March 31, December 31,(expressed in millions, except debt to equity ratio) 2021 2020
Cash and cash equivalents $ 538.5 $ 534.2
Current assets 677.0 663.7Non-current assets 5,070.2 4,929.2
Total assets $ 5,747.2 $ 5,592.9
Current liabilities 41.3 53.2Non-current liabilities 102.8 95.9
Total liabilities $ 144.1 $ 149.1
Total shareholders’ equity $ 5,603.1 $ 5,443.8 Total common shares outstanding 191.0 191.0
Key Financial Metrics Working Capital $ 635.7 $ 610.5 Debt to equity – –
Assets
Total assets were $5,747.2 million at March 31, 2021 compared to $5,592.9 million at December 31, 2020. Our asset base is primarily comprised of non-current assets such as our royalty, stream and working interests, equity investments and loan receivable, while our current assets primarily comprise cash and cash equivalents, and accounts receivable. The increase in non-current assets compared to December 31, 2020 reflects the acquisition of the Condestable stream and Séguéla royalty, and the increase in fair value of equity investments. These increases were partly offset by depletion and depreciation expense.
Liabilities
Total liabilities decreased slightly relative to December 31, 2020. Total liabilities as at March 31, 2021 primarily comprise $33.8 million of accounts payable and accrued liabilities and $98.4 million of deferred income tax liabilities.
Shareholders’ Equity
Shareholders’ equity increased by $159.3 million compared to December 31, 2020, reflecting net income of $171.5 million. Shareholders’ equity also includes a gain on the fair value of investments of $18.6 million and a gain of $9.4 million in currency translation adjustment in the first quarter of 2021. Declared dividends reduced shareholders’ equity by $49.9 million but were partly settled through the issuance of $8.1 million in common shares pursuant to the DRIP.
F N V T S X N Y S E F r a n c o - N eva d a C o r p o r a t i o n26
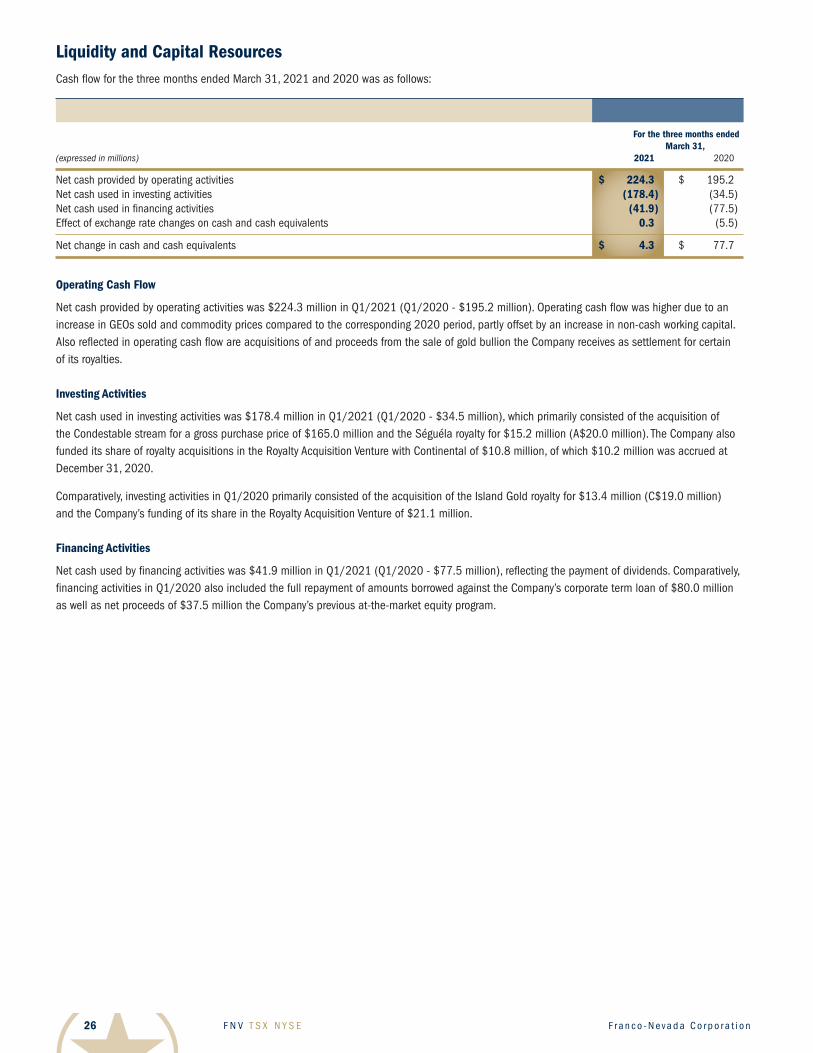
Liquidity and Capital ResourcesCash flow for the three months ended March 31, 2021 and 2020 was as follows:
For the three months ended March 31, (expressed in millions) 2021 2020
Net cash provided by operating activities $ 224.3 $ 195.2Net cash used in investing activities (178.4) (34.5 )Net cash used in financing activities (41.9) (77.5 )Effect of exchange rate changes on cash and cash equivalents 0.3 (5.5 )
Net change in cash and cash equivalents $ 4.3 $ 77.7
Operating Cash Flow
Net cash provided by operating activities was $224.3 million in Q1/2021 (Q1/2020 - $195.2 million). Operating cash flow was higher due to an increase in GEOs sold and commodity prices compared to the corresponding 2020 period, partly offset by an increase in non-cash working capital. Also reflected in operating cash flow are acquisitions of and proceeds from the sale of gold bullion the Company receives as settlement for certain of its royalties.
Investing Activities
Net cash used in investing activities was $178.4 million in Q1/2021 (Q1/2020 - $34.5 million), which primarily consisted of the acquisition of the Condestable stream for a gross purchase price of $165.0 million and the Séguéla royalty for $15.2 million (A$20.0 million). The Company also funded its share of royalty acquisitions in the Royalty Acquisition Venture with Continental of $10.8 million, of which $10.2 million was accrued at December 31, 2020.
Comparatively, investing activities in Q1/2020 primarily consisted of the acquisition of the Island Gold royalty for $13.4 million (C$19.0 million) and the Company’s funding of its share in the Royalty Acquisition Venture of $21.1 million.
Financing Activities
Net cash used by financing activities was $41.9 million in Q1/2021 (Q1/2020 - $77.5 million), reflecting the payment of dividends. Comparatively, financing activities in Q1/2020 also included the full repayment of amounts borrowed against the Company’s corporate term loan of $80.0 million as well as net proceeds of $37.5 million the Company’s previous at-the-market equity program.
2 0 2 1 F i r s t Q u a r t e r R e p o r t T h e G O L D I nve s t m e n t t h a t WO R K S 27
Capital Resources
Our cash and cash equivalents totaled $538.5 million as at March 31, 2021 (December 31, 2020 - $534.2 million). In addition, we held investments and loan receivables of $250.7 million as at March 31, 2021 (December 31, 2020 - $238.4 million), of which $203.1 million was held in publicly-traded equity instruments (December 31, 2020 - $191.8 million). Of the $203.1 million held in publicly-traded equity instruments, $186.4 million relate to our holdings of LIORC.
As at May 5, 2021, the Company also has a total of $931.6 million available under its two revolving credit facilities.
The Corporate Revolver is a $1.0 billion unsecured, revolving credit facility with a five-year term maturing March 22, 2024. Advances under the Corporate Revolver bear interest depending upon the currency of the advance and the Company’s leverage ratio. Funds are generally drawn using LIBOR 30-day rates plus 100 basis points. As at March 31, 2021, the Company has two standby letters of credit in the amount of $18.4 million (C$23.1 million) against the Corporate Revolver in relation to the audit by the CRA, as referenced in the “Contingencies” section of this MD&A. The standby letters of credit reduce the available balance under the Corporate Revolver. Subsequent to the period-end, on April 12, 2021, the Company drew down $150.0 million to finance part of the acquisition of the Vale Royalty Debentures, such that the available balance under the Corporate Revolver as at May 5, 2021 was $831.6 million. The funds were drawn as a one-month LIBOR loan with interest payable at a rate of LIBOR plus 100 basis points per annum.
The FNBC Revolver is a $0.1 billion unsecured, revolving credit facility. As at March 31, 2021, the available balance under the FNBC Revolver was $0.1 billion. The FNBC Revolver was amended on March 16, 2021 to extend the term to March 20, 2022. Under the amendment, funds are generally drawn using LIBOR 30-day rates plus 125 basis points.
Management’s objectives when managing capital are to:
(a) when capital is not being used for long-term investments, ensure its preservation and availability by investing in low-risk investments with highliquidity;and (b) ensure that adequate levels of capital are maintained to meet the Company’s operating requirements and other current liabilities.
As at March 31, 2021, the majority of funds were held in cash deposits with several financial institutions. Franco-Nevada invests its excess funds in term deposits. Certain investments with maturities upon acquisition of 3 months, or 92 days or less, were classified as term deposits within cash and cash equivalents on the statement of financial position.
Our performance is impacted by foreign currency fluctuations of the Canadian dollar and Australian dollar relative to the U.S. dollar. The largest exposure is with respect to the Canadian/U.S. dollar exchange rates as we hold a significant amount of our assets in Canada and report our results in U.S. dollars. The effect of volatility in these currencies against the U.S. dollar impacts our general and administrative expenses and depletion of Mining and Energy interests incurred in our Canadian and Australian entities due to their respective functional currencies. During 2021, the Canadian dollar traded in a range of $0.7795 to $0.8029, ending at $0.7952, and the Australian dollar traded between $0.7593 and $0.7952, ending at $0.7608.
Our near-term cash requirements include the potential funding of the upsize option with respect to the Alpala royalty, our funding commitments towards the Royalty Acquisition Venture with Continental, corporate administration costs, certain costs of operations, payment of dividends and income taxes directly related to the recognition of royalty, stream and working interest revenues. As a royalty and stream company, there are limited requirements for capital expenditures other than for the acquisition of additional royalties or streams and capital commitments for our working interests. Such acquisitions are entirely discretionary and will be consummated through the use of cash, as available, or through the issuance of common shares or other equity or debt securities, or the use of our credit facilities. We believe that our current cash resources, available credit facilities and future cash flows will be sufficient to cover the costs of our commitments, operating and administrative expenses, and dividend payments for the foreseeable future.
F N V T S X N Y S E F r a n c o - N eva d a C o r p o r a t i o n28
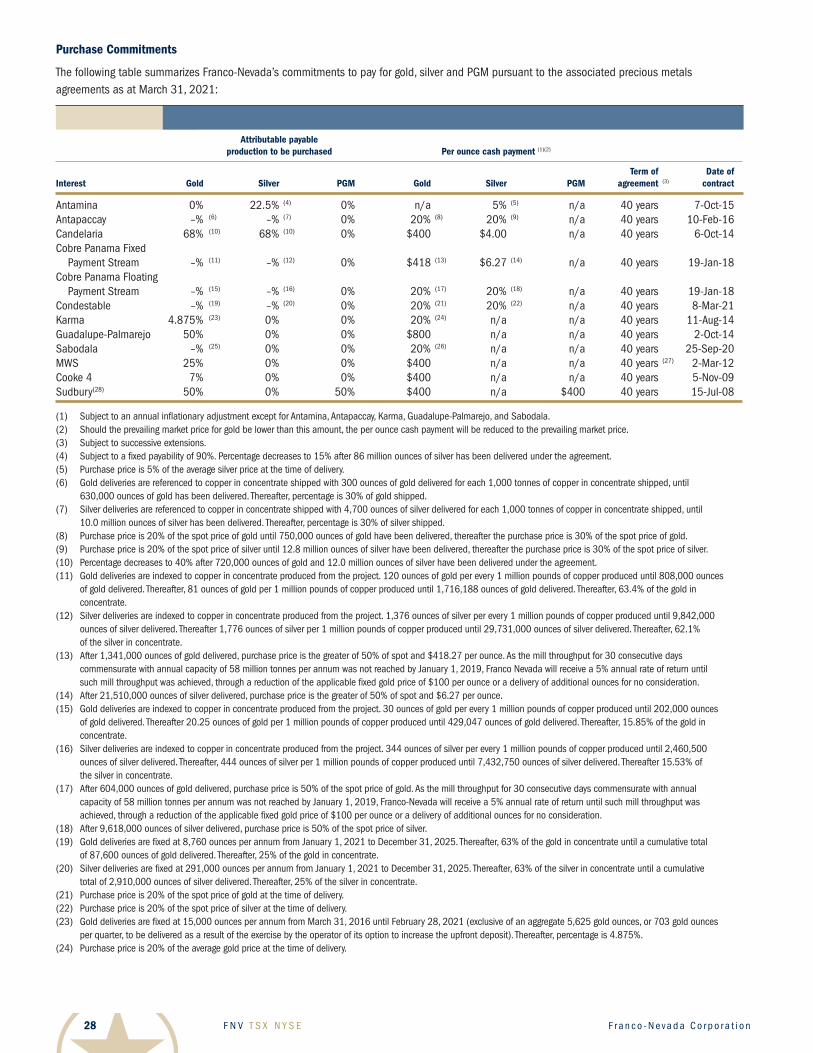
Purchase Commitments
The following table summarizes Franco-Nevada’s commitments to pay for gold, silver and PGM pursuant to the associated precious metals agreements as at March 31, 2021:
Attributable payable production to be purchased Per ounce cash payment (1)(2)
Termof DateofInterest Gold Silver PGM Gold Silver PGM agreement (3) contract
Antamina 0% 22.5% (4) 0% n/a 5% (5) n/a 40 years 7-Oct-15Antapaccay –% (6) –% (7) 0% 20% (8) 20% (9) n/a 40 years 10-Feb-16Candelaria 68% (10) 68% (10) 0% $400 $4.00 n/a 40 years 6-Oct-14Cobre Panama Fixed Payment Stream –% (11) –% (12) 0% $418 (13) $6.27 (14) n/a 40 years 19-Jan-18Cobre Panama Floating Payment Stream –% (15) –% (16) 0% 20% (17) 20% (18) n/a 40 years 19-Jan-18Condestable –% (19) –% (20) 0% 20% (21) 20% (22) n/a 40 years 8-Mar-21Karma 4.875% (23) 0% 0% 20% (24) n/a n/a 40 years 11-Aug-14Guadalupe-Palmarejo 50% 0% 0% $800 n/a n/a 40 years 2-Oct-14Sabodala –% (25) 0% 0% 20% (26) n/a n/a 40 years 25-Sep-20MWS 25% 0% 0% $400 n/a n/a 40 years (27) 2-Mar-12Cooke 4 7% 0% 0% $400 n/a n/a 40 years 5-Nov-09Sudbury(28) 50% 0% 50% $400 n/a $400 40 years 15-Jul-08
(1) Subject to an annual inflationary adjustment except for Antamina, Antapaccay, Karma, Guadalupe-Palmarejo, and Sabodala.(2) Should the prevailing market price for gold be lower than this amount, the per ounce cash payment will be reduced to the prevailing market price.(3) Subject to successive extensions.(4) Subject to a fixed payability of 90%. Percentage decreases to 15% after 86 million ounces of silver has been delivered under the agreement.(5) Purchase price is 5% of the average silver price at the time of delivery.(6) Gold deliveries are referenced to copper in concentrate shipped with 300 ounces of gold delivered for each 1,000 tonnes of copper in concentrate shipped, until
630,000 ounces of gold has been delivered. Thereafter, percentage is 30% of gold shipped.(7) Silver deliveries are referenced to copper in concentrate shipped with 4,700 ounces of silver delivered for each 1,000 tonnes of copper in concentrate shipped, until
10.0 million ounces of silver has been delivered. Thereafter, percentage is 30% of silver shipped.(8) Purchase price is 20% of the spot price of gold until 750,000 ounces of gold have been delivered, thereafter the purchase price is 30% of the spot price of gold.(9) Purchase price is 20% of the spot price of silver until 12.8 million ounces of silver have been delivered, thereafter the purchase price is 30% of the spot price of silver.(10) Percentage decreases to 40% after 720,000 ounces of gold and 12.0 million ounces of silver have been delivered under the agreement. (11) Gold deliveries are indexed to copper in concentrate produced from the project. 120 ounces of gold per every 1 million pounds of copper produced until 808,000 ounces
of gold delivered. Thereafter, 81 ounces of gold per 1 million pounds of copper produced until 1,716,188 ounces of gold delivered. Thereafter, 63.4% of the gold in concentrate.
(12) Silver deliveries are indexed to copper in concentrate produced from the project. 1,376 ounces of silver per every 1 million pounds of copper produced until 9,842,000 ounces of silver delivered. Thereafter 1,776 ounces of silver per 1 million pounds of copper produced until 29,731,000 ounces of silver delivered. Thereafter, 62.1% of the silver in concentrate.
(13) After 1,341,000 ounces of gold delivered, purchase price is the greater of 50% of spot and $418.27 per ounce. As the mill throughput for 30 consecutive days commensurate with annual capacity of 58 million tonnes per annum was not reached by January 1, 2019, Franco Nevada will receive a 5% annual rate of return until such mill throughput was achieved, through a reduction of the applicable fixed gold price of $100 per ounce or a delivery of additional ounces for no consideration.
(14) After 21,510,000 ounces of silver delivered, purchase price is the greater of 50% of spot and $6.27 per ounce. (15) Gold deliveries are indexed to copper in concentrate produced from the project. 30 ounces of gold per every 1 million pounds of copper produced until 202,000 ounces
of gold delivered. Thereafter 20.25 ounces of gold per 1 million pounds of copper produced until 429,047 ounces of gold delivered. Thereafter, 15.85% of the gold in concentrate.
(16) Silver deliveries are indexed to copper in concentrate produced from the project. 344 ounces of silver per every 1 million pounds of copper produced until 2,460,500 ounces of silver delivered. Thereafter, 444 ounces of silver per 1 million pounds of copper produced until 7,432,750 ounces of silver delivered. Thereafter 15.53% of the silver in concentrate.
(17) After 604,000 ounces of gold delivered, purchase price is 50% of the spot price of gold. As the mill throughput for 30 consecutive days commensurate with annual capacity of 58 million tonnes per annum was not reached by January 1, 2019, Franco-Nevada will receive a 5% annual rate of return until such mill throughput was achieved, through a reduction of the applicable fixed gold price of $100 per ounce or a delivery of additional ounces for no consideration.
(18) After 9,618,000 ounces of silver delivered, purchase price is 50% of the spot price of silver. (19) Gold deliveries are fixed at 8,760 ounces per annum from January 1, 2021 to December 31, 2025. Thereafter, 63% of the gold in concentrate until a cumulative total
of 87,600 ounces of gold delivered. Thereafter, 25% of the gold in concentrate.(20) Silver deliveries are fixed at 291,000 ounces per annum from January 1, 2021 to December 31, 2025. Thereafter, 63% of the silver in concentrate until a cumulative
total of 2,910,000 ounces of silver delivered. Thereafter, 25% of the silver in concentrate.(21) Purchase price is 20% of the spot price of gold at the time of delivery. (22) Purchase price is 20% of the spot price of silver at the time of delivery. (23) Gold deliveries are fixed at 15,000 ounces per annum from March 31, 2016 until February 28, 2021 (exclusive of an aggregate 5,625 gold ounces, or 703 gold ounces
per quarter, to be delivered as a result of the exercise by the operator of its option to increase the upfront deposit). Thereafter, percentage is 4.875%.(24) Purchase price is 20% of the average gold price at the time of delivery.
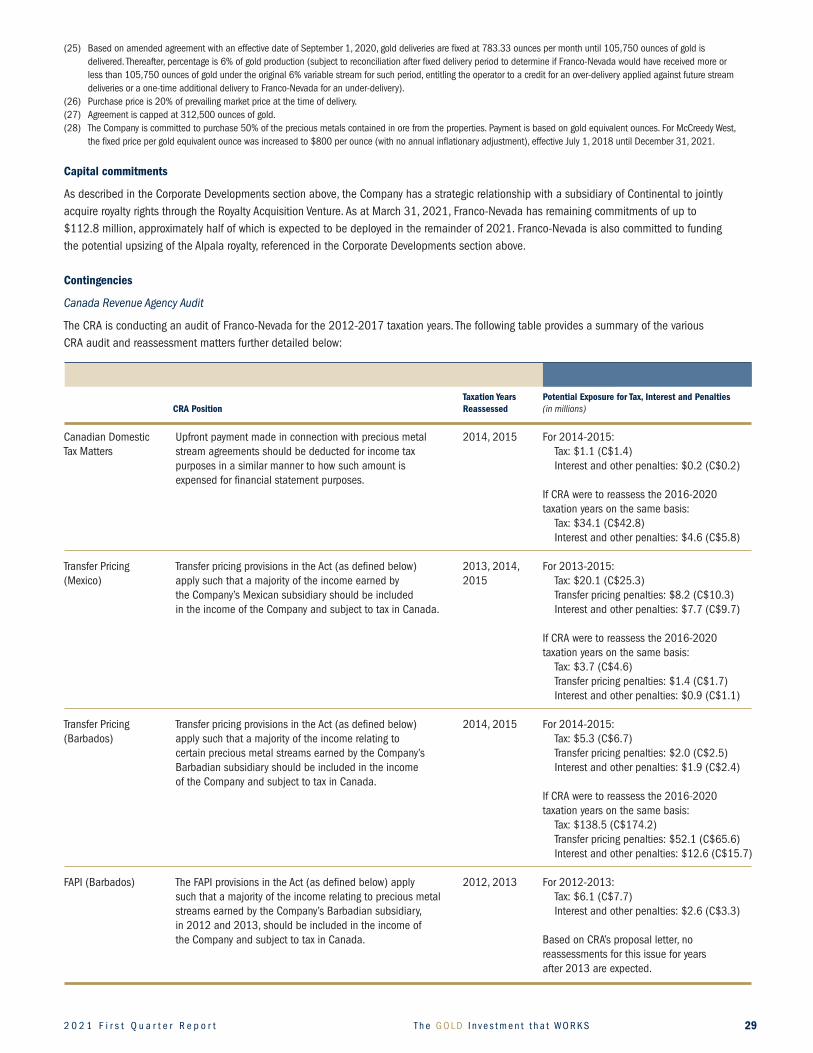
2 0 2 1 F i r s t Q u a r t e r R e p o r t T h e G O L D I nve s t m e n t t h a t WO R K S 29
(25) Based on amended agreement with an effective date of September 1, 2020, gold deliveries are fixed at 783.33 ounces per month until 105,750 ounces of gold is delivered. Thereafter, percentage is 6% of gold production (subject to reconciliation after fixed delivery period to determine if Franco-Nevada would have received more or less than 105,750 ounces of gold under the original 6% variable stream for such period, entitling the operator to a credit for an over-delivery applied against future stream deliveries or a one-time additional delivery to Franco-Nevada for an under-delivery).
(26) Purchase price is 20% of prevailing market price at the time of delivery.(27) Agreement is capped at 312,500 ounces of gold.(28) The Company is committed to purchase 50% of the precious metals contained in ore from the properties. Payment is based on gold equivalent ounces. For McCreedy West,
the fixed price per gold equivalent ounce was increased to $800 per ounce (with no annual inflationary adjustment), effective July 1, 2018 until December 31, 2021.
Capital commitments
As described in the Corporate Developments section above, the Company has a strategic relationship with a subsidiary of Continental to jointly acquire royalty rights through the Royalty Acquisition Venture. As at March 31, 2021, Franco-Nevada has remaining commitments of up to $112.8 million, approximately half of which is expected to be deployed in the remainder of 2021. Franco-Nevada is also committed to funding the potential upsizing of the Alpala royalty, referenced in the Corporate Developments section above.
Contingencies
Canada Revenue Agency Audit
The CRA is conducting an audit of Franco-Nevada for the 2012-2017 taxation years. The following table provides a summary of the various CRA audit and reassessment matters further detailed below:
TaxationYears PotentialExposureforTax,InterestandPenalties CRA Position Reassessed (in millions)
Canadian Domestic Upfront payment made in connection with precious metal 2014, 2015 For 2014-2015:Tax Matters stream agreements should be deducted for income tax Tax: $1.1 (C$1.4) purposes in a similar manner to how such amount is Interest and other penalties: $0.2 (C$0.2) expensed for financial statement purposes. If CRA were to reassess the 2016-2020 taxation years on the same basis: Tax: $34.1 (C$42.8) Interest and other penalties: $4.6 (C$5.8)
Transfer Pricing Transfer pricing provisions in the Act (as defined below) 2013, 2014, For 2013-2015:(Mexico) apply such that a majority of the income earned by 2015 Tax: $20.1 (C$25.3) the Company’s Mexican subsidiary should be included Transfer pricing penalties: $8.2 (C$10.3) in the income of the Company and subject to tax in Canada. Interest and other penalties: $7.7 (C$9.7)
If CRA were to reassess the 2016-2020 taxation years on the same basis: Tax: $3.7 (C$4.6) Transfer pricing penalties: $1.4 (C$1.7) Interest and other penalties: $0.9 (C$1.1)
Transfer Pricing Transfer pricing provisions in the Act (as defined below) 2014, 2015 For 2014-2015:(Barbados) apply such that a majority of the income relating to Tax: $5.3 (C$6.7) certain precious metal streams earned by the Company’s Transfer pricing penalties: $2.0 (C$2.5) Barbadian subsidiary should be included in the income Interest and other penalties: $1.9 (C$2.4) of the Company and subject to tax in Canada. If CRA were to reassess the 2016-2020 taxation years on the same basis: Tax: $138.5 (C$174.2) Transfer pricing penalties: $52.1 (C$65.6) Interest and other penalties: $12.6 (C$15.7)
FAPI (Barbados) The FAPI provisions in the Act (as defined below) apply 2012, 2013 For 2012-2013: such that a majority of the income relating to precious metal Tax: $6.1 (C$7.7) streams earned by the Company’s Barbadian subsidiary, Interest and other penalties: $2.6 (C$3.3) in 2012 and 2013, should be included in the income of the Company and subject to tax in Canada. Based on CRA’s proposal letter, no reassessments for this issue for years after 2013 are expected.
F N V T S X N Y S E F r a n c o - N eva d a C o r p o r a t i o n30
(a) Canadian Domestic Tax Matters (2014-2015):
In October 2019, certain wholly-owned Canadian subsidiaries of the Company received Notices of Reassessment for the 2014 and 2015 taxation years (the “Domestic Reassessments”) in which the CRA increased income by adjusting the timing of the deduction of the upfront payments which were made in connection with precious metal stream agreements. The CRA’s position is that the upfront payment should be deducted for income tax purposes in a similar manner to how such upfront payment is expensed for financial statement purposes. Consequently, the CRA’s position results in a slower deduction of the upfront payment and an acceleration of the payment of Canadian taxes. This results in the Company being subject to an incremental payment of Federal and provincial income taxes for these years of $1.1 million (C$1.4 million) (after applying available non-capital losses and other deductions) plus estimated interest (calculated to March 31, 2021) and other penalties of $0.2 million (C$0.2 million). The Company has filed formal Notices of Objection with the CRA against the Domestic Reassessments and has posted security in cash for 50% of the reassessed amounts of tax, interest and penalties. The Company intends to commence an appeal in the Tax Court of Canada with respect to these reassessments.
If the CRA were to reassess the particular Canadian subsidiaries for taxation years 2016 through 2020 on the same basis, the Company estimates that it would be subject to an incremental payment of Canadian tax for these years of approximately $34.1 million (C$42.8 million) (after applying available non-capital losses and other deductions) plus interest (calculated to March 31, 2021) and other penalties of approximately $4.6 million (C$5.8 million). Similarly, an additional amount of tax, interest and applicable penalties would arise for the 2021 taxation year.
(b) Mexico (2013-2015):
In December 2018, the Company received a Notice of Reassessment from the CRA for the 2013 taxation year (the “2013 Reassessment”) in relation to its Mexican subsidiary. The reassessment was made on the basis of the transfer pricing provisions in the Income Tax Act (Canada) (the “Act”) and asserts that a majority of the income earned by the Mexican subsidiary should have been included in the income of the Company and subject to tax in Canada. The 2013 Reassessment results in additional Federal and provincial income taxes of $8.6 million (C$10.8 million) plus estimated interest (calculated to March 31, 2021) and other penalties of $3.5 million (C$4.4 million) but before any relief under the Canada-Mexico tax treaty.
In December 2019, the Company received Notices of Reassessment for the 2014 and 2015 taxation years (the “2014 and 2015 Reassessments”) on the same basis as the 2013 Reassessment, resulting in additional Federal and provincial income taxes of $11.5 million (C$14.5 million) plus estimated interest (calculated to March 31, 2021) and other penalties of $4.2 million (C$5.3 million) but before any relief under the Canada-Mexico tax treaty.
The Company has filed formal Notices of Objection with the CRA against the 2013 Reassessment and the 2014 and 2015 Reassessments and has posted security in the form of a standby letter of credit for 50% of the reassessed amounts of tax, interest and penalties, as referenced in Note 9 (a). Further, the Company has commenced an appeal in the Tax Court of Canada with respect to these reassessments.
For taxation years 2013 through 2015, the Company’s Mexican subsidiary paid a total of $30.3 million (419.4 million Pesos) in cash taxes, at a 30% tax rate, to the Mexican tax authorities on income earned in Mexico. If required, the Company intends to seek relief from double taxation under the Canada-Mexico tax treaty.
In December 2020, the CRA issued revised 2013 Reassessment and 2014 and 2015 Reassessments to include transfer pricing penalties of $8.2 million (C$10.3 million). The Company has filed formal Notices of Objection with the CRA against these revised reassessments and has posted security in the form of cash for 50% of the reassessed amounts of penalties. The Company intends to commence an appeal in the Tax Court of Canada with respect to these revised reassessments.
If the CRA were to reassess the Company for taxation years 2016 through 2020 on the same basis and continue to apply transfer pricing penalties, the Company estimates that it would be subject to additional Canadian tax for these years of approximately $3.7 million (C$4.6 million), transfer pricing penalties of approximately $1.4 million (C$1.7 million) plus interest (calculated to March 31, 2021) and other penalties of approximately $0.9 million (C$1.1 million) but before any relief under the Canada-Mexico tax treaty. The Company’s Mexican subsidiary paid $3.8 million (71.0 million Pesos) in cash taxes, at a 30% tax rate, to the Mexican tax authorities on income earned in Mexico for the 2016 year and ceased operations after 2016.
2 0 2 1 F i r s t Q u a r t e r R e p o r t T h e G O L D I nve s t m e n t t h a t WO R K S 31
(c) Barbados (2014-2015):
The 2014 and 2015 Reassessments also reassess the Company in relation to its Barbadian subsidiary. The reassessments were made on the basis of the transfer pricing provisions in the Act and assert that a majority of the income relating to certain precious metal streams earned by the Barbadian subsidiary should have been included in the income of the Company and subject to tax in Canada, resulting in additional Federal and provincial income taxes of $5.3 million (C$6.7 million) plus estimated interest (calculated to March 31, 2021) and other penalties of $1.9 million (C$2.4 million). As noted previously, the Company has filed formal Notices of Objection with the CRA against the 2014 and 2015 Reassessments and has posted security in the form of a standby letter of credit for 50% of the reassessed amounts of tax, interest and penalties, as referenced in Note 9 (a). Further, the Company has commenced an appeal in the Tax Court of Canada with respect to the 2014 and 2015 Reassessments.
As noted above, in December 2020, the CRA issued revised 2014 and 2015 Reassessments to include transfer pricing penalties of $2.0 million (C$2.5 million). The Company has filed formal Notices of Objection with the CRA against these revised reassessments and has posted security in the form of cash for 50% of the reassessed amounts of penalties. The Company intends to commence an appeal in the Tax Court of Canada with respect to these revised reassessments.
If the CRA were to reassess the Company for taxation years 2016 through 2020 on the same basis and continue to apply transfer pricing penalties, the Company estimates that it would be subject to additional Canadian tax for these years of approximately $138.5 million (C$174.2 million), transfer pricing penalties of approximately $52.1 million (C$65.6 million) plus interest (calculated to March 31, 2021) and other penalties of approximately $12.6 million (C$15.7 million). Similarly, an additional amount of tax, interest and applicable penalties would arise for the 2021 taxation year.
(d) Barbados (2012-2013):
In August 2020, the Company received Notices of Reassessment for the 2012 and 2013 taxation years (the “FAPI Reassessments” and, collectively with the Domestic Reassessments, the 2013 Reassessment and the 2014 and 2015 Reassessments, the “Reassessments”) in relation to its Barbadian subsidiary. The reassessments assert that a majority of the income relating to precious metal streams earned by the Barbadian subsidiary, in those years, should have been included in the income of its Canadian parent company and subject to tax in Canada as Foreign Accrual Property Income (“FAPI”). The CRA has noted that its position may not extend beyond the 2013 taxation year. The FAPI Reassessments result in additional Federal and provincial income taxes of $6.1 million (C$7.7 million) plus estimated interest (calculated to March 31, 2021) and other penalties of $2.6 million (C$3.3 million). The Company has filed formal Notices of Objection with the CRA against the FAPI Reassessments and has posted security in cash for 50% of the reassessed amounts of tax, interest and penalties.
The CRA recently expanded its audit to include the 2016 and 2017 taxation years and the Company has not received any proposal or notices of reassessment for these taxation years.
Management believes that the Company and its subsidiaries have filed all tax returns and paid all applicable taxes in compliance with Canadian and applicable foreign tax laws and, as a result, no amounts have been recorded in the financial statements of the Company for the Reassessments, or for any potential tax exposure that may arise in respect of these matters. The Company does not believe that the Reassessments are supported by Canadian tax law and jurisprudence and intends to vigorously defend its tax filing positions.
The CRA audit is ongoing and there can be no assurance that the CRA will not further challenge the manner in which the Company or any of its subsidiaries has filed its tax returns and reported its income. In the event that the CRA successfully challenges the manner in which the Company or a subsidiary has filed its tax returns and reported its income, this could potentially result in additional income taxes, penalties and interest, which could have a material adverse effect on the Company.
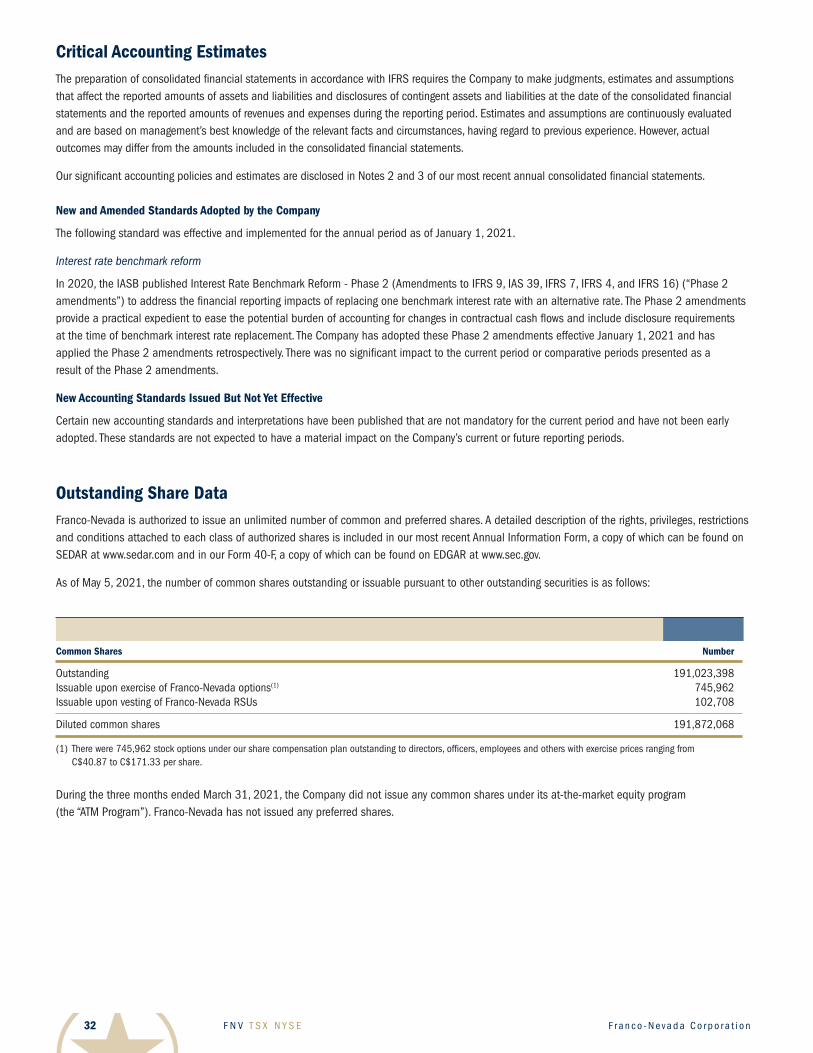
F N V T S X N Y S E F r a n c o - N eva d a C o r p o r a t i o n32
Critical Accounting EstimatesThe preparation of consolidated financial statements in accordance with IFRS requires the Company to make judgments, estimates and assumptions that affect the reported amounts of assets and liabilities and disclosures of contingent assets and liabilities at the date of the consolidated financial statements and the reported amounts of revenues and expenses during the reporting period. Estimates and assumptions are continuously evaluated and are based on management’s best knowledge of the relevant facts and circumstances, having regard to previous experience. However, actual outcomes may differ from the amounts included in the consolidated financial statements.
Our significant accounting policies and estimates are disclosed in Notes 2 and 3 of our most recent annual consolidated financial statements.
New and Amended Standards Adopted by the Company
The following standard was effective and implemented for the annual period as of January 1, 2021.
Interest rate benchmark reform
In 2020, the IASB published Interest Rate Benchmark Reform - Phase 2 (Amendments to IFRS 9, IAS 39, IFRS 7, IFRS 4, and IFRS 16) (“Phase 2 amendments”) to address the financial reporting impacts of replacing one benchmark interest rate with an alternative rate. The Phase 2 amendments provide a practical expedient to ease the potential burden of accounting for changes in contractual cash flows and include disclosure requirements at the time of benchmark interest rate replacement. The Company has adopted these Phase 2 amendments effective January 1, 2021 and has applied the Phase 2 amendments retrospectively. There was no significant impact to the current period or comparative periods presented as a result of the Phase 2 amendments.
NewAccountingStandardsIssuedButNotYetEffective
Certain new accounting standards and interpretations have been published that are not mandatory for the current period and have not been early adopted. These standards are not expected to have a material impact on the Company’s current or future reporting periods.
Outstanding Share DataFranco-Nevada is authorized to issue an unlimited number of common and preferred shares. A detailed description of the rights, privileges, restrictions and conditions attached to each class of authorized shares is included in our most recent Annual Information Form, a copy of which can be found on SEDAR at www.sedar.com and in our Form 40-F, a copy of which can be found on EDGAR at www.sec.gov.
As of May 5, 2021, the number of common shares outstanding or issuable pursuant to other outstanding securities is as follows:
Common Shares Number
Outstanding 191,023,398Issuable upon exercise of Franco-Nevada options(1) 745,962Issuable upon vesting of Franco-Nevada RSUs 102,708
Diluted common shares 191,872,068
(1) There were 745,962 stock options under our share compensation plan outstanding to directors, officers, employees and others with exercise prices ranging from C$40.87 to C$171.33 per share.
During the three months ended March 31, 2021, the Company did not issue any common shares under its at-the-market equity program (the “ATM Program”). Franco-Nevada has not issued any preferred shares.

2 0 2 1 F i r s t Q u a r t e r R e p o r t T h e G O L D I nve s t m e n t t h a t WO R K S 33
Internal Control Over Financial Reporting and Disclosure Controls and ProceduresOur management is responsible for establishing and maintaining Franco-Nevada’s internal control over financial reporting and other financial disclosure and our disclosure controls and procedures.
Internal control over financial reporting is a process designed to provide reasonable assurance regarding the reliability of financial reporting and the preparation of financial statements for external purposes in accordance with IFRS. Franco-Nevada’s internal control over financial reporting includes those policies and procedures that (i) pertain to the maintenance of records that, in reasonable detail, accurately and fairly reflect the transactionsanddispositionsoftheassetsofFranco-Nevada;(ii)aredesignedtoprovidereasonableassurancethattransactionsarerecordedasnecessary to permit preparation of financial statements in accordance with IFRS, and that receipts and expenditures of Franco-Nevada are being madeonlyinaccordancewithauthorizationsofmanagementanddirectorsofFranco-Nevada;and(iii)aredesignedtoprovidereasonableassuranceregarding prevention or timely detection of unauthorized acquisition, use or disposition of Franco-Nevada’s assets that could have a material effect on Franco-Nevada’s financial statements. Internal control over other financial disclosure is a process designed to ensure that other financial information included in this MD&A, fairly represents in all material respects the financial condition, results of operations and cash flows of Franco-Nevada for the periods presented in this MD&A.
Franco-Nevada’s disclosure controls and procedures are designed to provide reasonable assurance that material information relating to Franco-Nevada, including its consolidated subsidiaries, is made known to management by others within those entities, particularly during the period in which this report is prepared and that information required to be disclosed by Franco-Nevada in its annual filings, interim filings or other reports filed or submitted by it under securities legislation is recorded, processed, summarized and reported within the time periods specified in securities legislation.
Due to its inherent limitations, internal control over financial reporting and other financial disclosure may not prevent or detect all misstatements. Also, projections of any evaluation of effectiveness to future periods are subject to the risk that controls may become inadequate because of changes in conditions, or that the degree of compliance with the policies or procedures may change.
For the three months ended March 31, 2021, there has been no change in Franco-Nevada’s internal control over financial reporting that has materially affected, or is reasonably likely to materially affect, Franco-Nevada’s internal control over financial reporting.
Non-IFRS Financial Measures Cash Costs attributable to GEOs sold and Cash Costs per GEO
Cash Costs attributable to GEOs sold and Cash Costs per GEO sold are non-IFRS financial measures. Cash Costs are calculated by starting with total costs of sales and removing depletion and depreciation, and costs not attributable to GEOs sold such as our Energy operating costs. Cash Costs per GEO sold are calculated by dividing Cash Costs by the number of GEOs sold in the period, excluding prepaid GEOs.
Management uses Cash Costs and Cash Costs per GEO sold to evaluate the Company’s ability to generate positive cash flow from its mining royalty, stream and working interests. Management and certain investors also use this information to evaluate the Company’s performance relative to peers in the mining industry who present this measure on a similar basis. Cash Costs and Cash Costs per GEO are only intended to provide additional information to investors and analysts and should not be considered in isolation or as a substitute for measures of performance prepared in accordance with IFRS. They do not have any standardized meaning under IFRS, and may not be comparable to similar measures presented by other issuers.
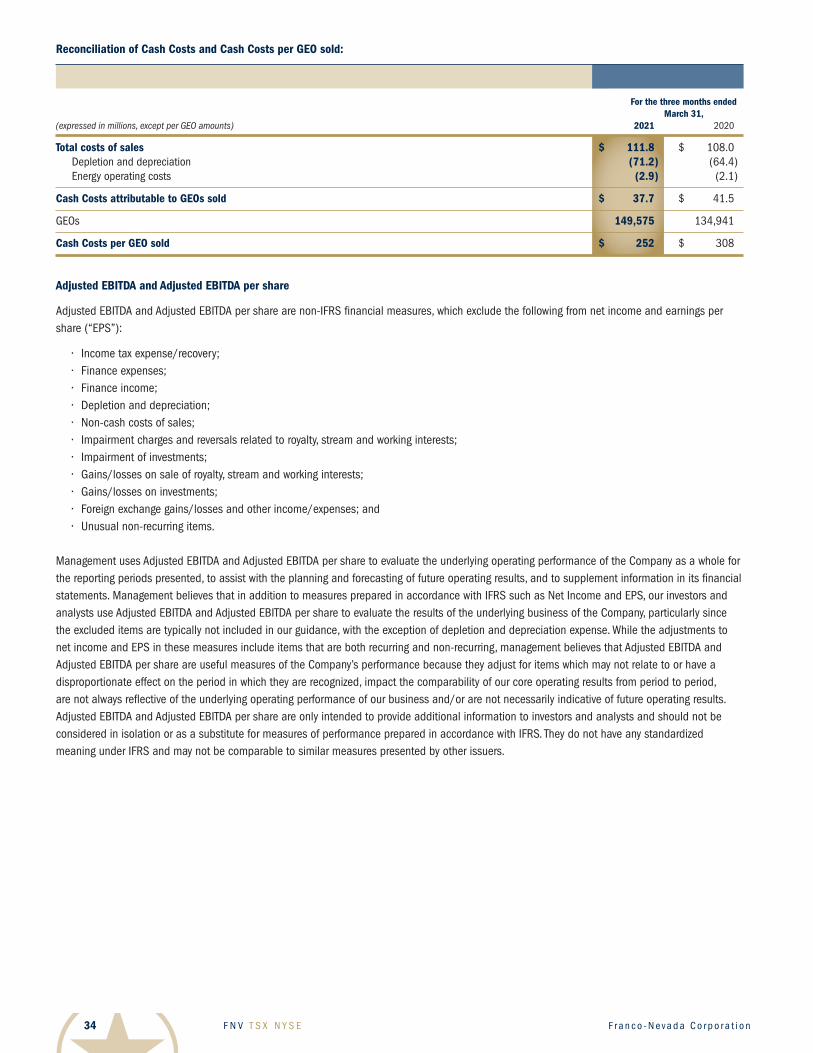
F N V T S X N Y S E F r a n c o - N eva d a C o r p o r a t i o n34
Reconciliation of Cash Costs and Cash Costs per GEO sold:
For the three months ended March 31, (expressed in millions, except per GEO amounts) 2021 2020
Totalcostsofsales $ 111.8 $ 108.0 Depletion and depreciation (71.2) (64.4 ) Energy operating costs (2.9) (2.1 )
Cash Costs attributable to GEOs sold $ 37.7 $ 41.5
GEOs 149,575 134,941
Cash Costs per GEO sold $ 252 $ 308
AdjustedEBITDAandAdjustedEBITDApershare
Adjusted EBITDA and Adjusted EBITDA per share are non-IFRS financial measures, which exclude the following from net income and earnings per share (“EPS”):
• Incometaxexpense/recovery;• Financeexpenses;• Financeincome;• Depletionanddepreciation;• Non-cashcostsofsales;• Impairmentchargesandreversalsrelatedtoroyalty,streamandworkinginterests;• Impairmentofinvestments;• Gains/lossesonsaleofroyalty,streamandworkinginterests;• Gains/lossesoninvestments;• Foreignexchangegains/lossesandotherincome/expenses;and• Unusualnon-recurringitems.
Management uses Adjusted EBITDA and Adjusted EBITDA per share to evaluate the underlying operating performance of the Company as a whole for the reporting periods presented, to assist with the planning and forecasting of future operating results, and to supplement information in its financial statements. Management believes that in addition to measures prepared in accordance with IFRS such as Net Income and EPS, our investors and analysts use Adjusted EBITDA and Adjusted EBITDA per share to evaluate the results of the underlying business of the Company, particularly since the excluded items are typically not included in our guidance, with the exception of depletion and depreciation expense. While the adjustments to net income and EPS in these measures include items that are both recurring and non-recurring, management believes that Adjusted EBITDA and Adjusted EBITDA per share are useful measures of the Company’s performance because they adjust for items which may not relate to or have a disproportionate effect on the period in which they are recognized, impact the comparability of our core operating results from period to period, are not always reflective of the underlying operating performance of our business and/or are not necessarily indicative of future operating results. Adjusted EBITDA and Adjusted EBITDA per share are only intended to provide additional information to investors and analysts and should not be considered in isolation or as a substitute for measures of performance prepared in accordance with IFRS. They do not have any standardized meaning under IFRS and may not be comparable to similar measures presented by other issuers.
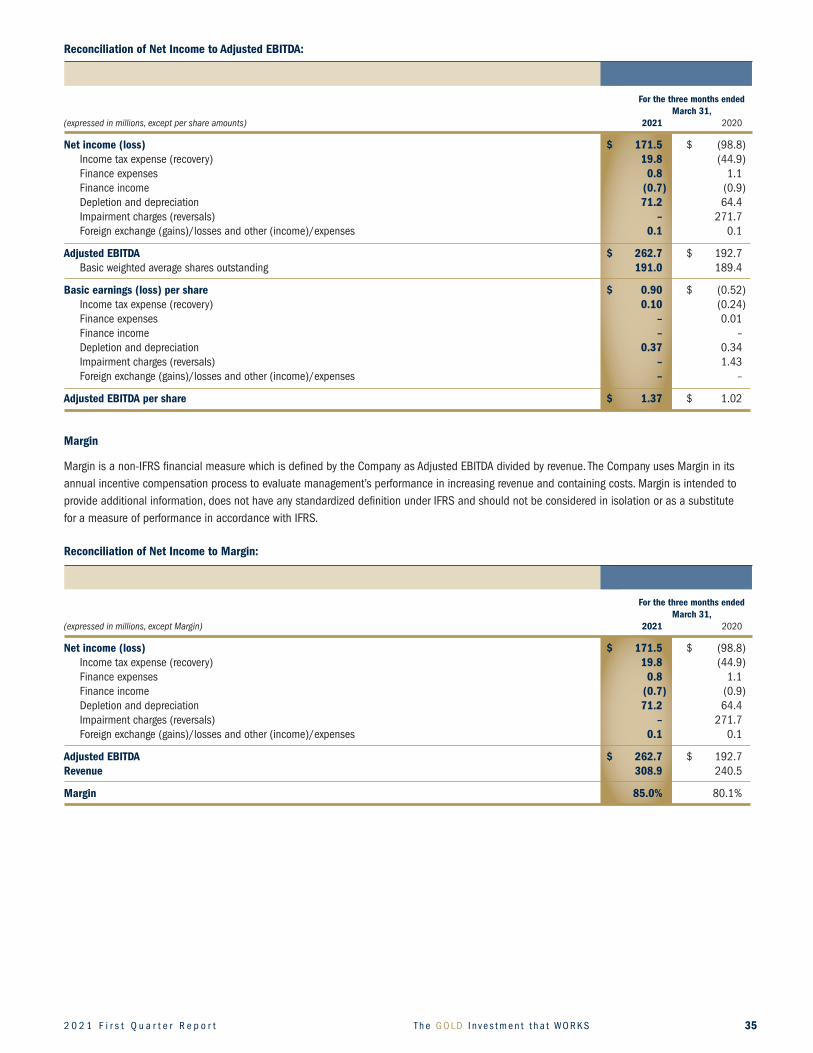
2 0 2 1 F i r s t Q u a r t e r R e p o r t T h e G O L D I nve s t m e n t t h a t WO R K S 35
ReconciliationofNetIncometoAdjustedEBITDA:
For the three months ended March 31, (expressed in millions, except per share amounts) 2021 2020
Netincome(loss) $ 171.5 $ (98.8 ) Income tax expense (recovery) 19.8 (44.9 ) Finance expenses 0.8 1.1 Finance income (0.7) (0.9 ) Depletion and depreciation 71.2 64.4 Impairment charges (reversals) – 271.7 Foreign exchange (gains)/losses and other (income)/expenses 0.1 0.1
AdjustedEBITDA $ 262.7 $ 192.7 Basic weighted average shares outstanding 191.0 189.4
Basicearnings(loss)pershare $ 0.90 $ (0.52 ) Income tax expense (recovery) 0.10 (0.24 ) Finance expenses – 0.01 Finance income – – Depletion and depreciation 0.37 0.34 Impairment charges (reversals) – 1.43 Foreign exchange (gains)/losses and other (income)/expenses – –
AdjustedEBITDApershare $ 1.37 $ 1.02
Margin
Margin is a non-IFRS financial measure which is defined by the Company as Adjusted EBITDA divided by revenue. The Company uses Margin in its annual incentive compensation process to evaluate management’s performance in increasing revenue and containing costs. Margin is intended to provide additional information, does not have any standardized definition under IFRS and should not be considered in isolation or as a substitute for a measure of performance in accordance with IFRS.
Reconciliation of Net Income to Margin:
For the three months ended March 31, (expressed in millions, except Margin) 2021 2020
Netincome(loss) $ 171.5 $ (98.8 ) Income tax expense (recovery) 19.8 (44.9 ) Finance expenses 0.8 1.1 Finance income (0.7) (0.9 ) Depletion and depreciation 71.2 64.4 Impairment charges (reversals) – 271.7 Foreign exchange (gains)/losses and other (income)/expenses 0.1 0.1
AdjustedEBITDA $ 262.7 $ 192.7Revenue 308.9 240.5
Margin 85.0% 80.1%
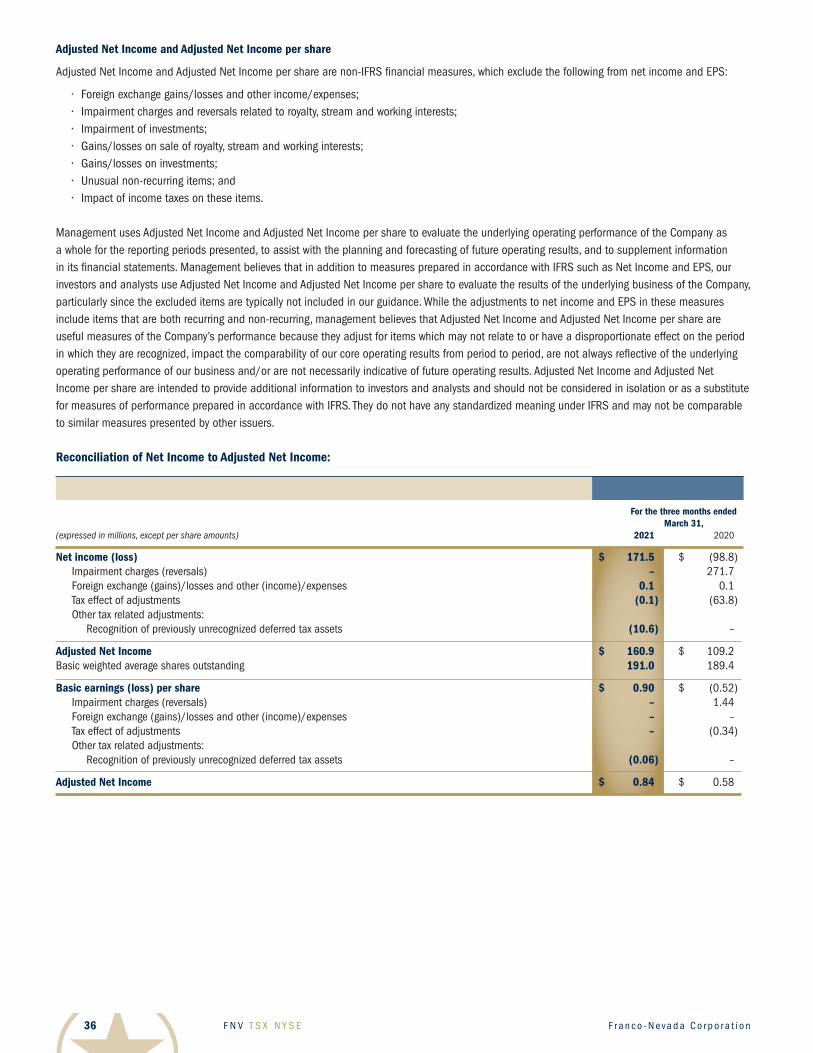
F N V T S X N Y S E F r a n c o - N eva d a C o r p o r a t i o n36
AdjustedNetIncomeandAdjustedNetIncomepershare
Adjusted Net Income and Adjusted Net Income per share are non-IFRS financial measures, which exclude the following from net income and EPS:
• Foreignexchangegains/lossesandotherincome/expenses;• Impairmentchargesandreversalsrelatedtoroyalty,streamandworkinginterests;• Impairmentofinvestments;• Gains/lossesonsaleofroyalty,streamandworkinginterests;• Gains/lossesoninvestments;• Unusualnon-recurringitems;and• Impactofincometaxesontheseitems.
Management uses Adjusted Net Income and Adjusted Net Income per share to evaluate the underlying operating performance of the Company as a whole for the reporting periods presented, to assist with the planning and forecasting of future operating results, and to supplement information in its financial statements. Management believes that in addition to measures prepared in accordance with IFRS such as Net Income and EPS, our investors and analysts use Adjusted Net Income and Adjusted Net Income per share to evaluate the results of the underlying business of the Company, particularly since the excluded items are typically not included in our guidance. While the adjustments to net income and EPS in these measures include items that are both recurring and non-recurring, management believes that Adjusted Net Income and Adjusted Net Income per share are useful measures of the Company’s performance because they adjust for items which may not relate to or have a disproportionate effect on the period in which they are recognized, impact the comparability of our core operating results from period to period, are not always reflective of the underlying operating performance of our business and/or are not necessarily indicative of future operating results. Adjusted Net Income and Adjusted Net Income per share are intended to provide additional information to investors and analysts and should not be considered in isolation or as a substitute for measures of performance prepared in accordance with IFRS. They do not have any standardized meaning under IFRS and may not be comparable to similar measures presented by other issuers.
ReconciliationofNetIncometoAdjustedNetIncome:
For the three months ended March 31, (expressed in millions, except per share amounts) 2021 2020
Netincome(loss) $ 171.5 $ (98.8 ) Impairment charges (reversals) – 271.7 Foreign exchange (gains)/losses and other (income)/expenses 0.1 0.1 Tax effect of adjustments (0.1) (63.8 ) Other tax related adjustments: Recognition of previously unrecognized deferred tax assets (10.6) –
AdjustedNetIncome $ 160.9 $ 109.2Basic weighted average shares outstanding 191.0 189.4
Basicearnings(loss)pershare $ 0.90 $ (0.52 ) Impairment charges (reversals) – 1.44 Foreign exchange (gains)/losses and other (income)/expenses – – Tax effect of adjustments – (0.34 ) Other tax related adjustments: Recognition of previously unrecognized deferred tax assets (0.06) –
AdjustedNetIncome $ 0.84 $ 0.58
2 0 2 1 F i r s t Q u a r t e r R e p o r t T h e G O L D I nve s t m e n t t h a t WO R K S 37
Cautionary Statement on Forward-Looking Information This MD&A contains “forward-looking information” and “forward-looking statements” within the meaning of applicable Canadian securities laws and the United States Private Securities Litigation Reform Act of 1995, respectively, which may include, but are not limited to, statements with respect to future events or future performance, management’s expectations regarding Franco-Nevada’s growth, results of operations, estimated future revenues, performance guidance, carrying value of assets, future dividends and requirements for additional capital, mineral reserve and mineral resource estimates, production estimates, production costs and revenue, future demand for and prices of commodities, expected mining sequences, business prospects and opportunities, the performance and plans of third party operators, audits being conducted by the CRA, the expected exposure for current and future assessments and available remedies, the remedies relating to and consequences of the ruling of the Supreme Court of Panama in relation to the Cobre Panama project, the aggregate value of Common Shares which may be issued pursuant to the ATM Program, and the Company’s expected use of the net proceeds of the ATM Program, if any. In addition, statements (including data in tables) relating to reserves and resources including reserves and resources covered by a royalty, stream or other interest, gold equivalent ounces or mine lives are forward-looking statements, as they involve implied assessment, based on certain estimates and assumptions, and no assurance can be given that the estimates and assumptions are accurate and that such reserves and resources, mine lives and GEOs will be realized. Such forward-looking statements reflect management’s current beliefs and are based on information currently available to management. Often, but not always, forward-looking statements can be identified by the use of words such as “plans”, “expects”, “is expected”, “budgets”, “potential for”, “scheduled”, “estimates”, “forecasts”, “predicts”, “projects”, “intends”, “targets”, “aims”, “anticipates” or “believes” or variations (including negative variations) of such words and phrases or may be identified by statements to the effect that certain actions “may”, “could”, “should”, “would”, “might” or “will” be taken, occur or be achieved. Forward-looking statements involve known and unknown risks, uncertainties and other factors, which may cause the actual results, performance or achievements of Franco-Nevada to be materially different from any future results, performance or achievements expressed or implied by the forward-looking statements. A number of factors could cause actual events or results to differ materially from any forward-looking statement, including, without limitation: the price at which Common Shares are sold in the ATM Program and the aggregate net proceedsreceivedbytheCompanyasaresultoftheATMProgram;fluctuationsinthepricesoftheprimarycommoditiesthatdriveroyaltyandstreamrevenue(gold,platinumgroupmetals,copper,nickel,uranium,silver,iron-oreandoilandgas);fluctuationsinthevalueoftheCanadianandAustraliandollar,Mexicanpesoandanyothercurrencyinwhichrevenueisgenerated,relativetotheU.S.dollar;changesinnationalandlocalgovernmentlegislation,includingpermittingandlicensingregimesandtaxationpoliciesandtheenforcementthereof;regulatory,politicaloreconomicdevelopmentsinanyofthecountrieswherepropertiesinwhichFranco-Nevadaholdsaroyalty,streamorotherinterestarelocatedorthroughwhichtheyareheld;risksrelatedtothe operators of the properties in which Franco-Nevada holds a royalty, stream or other interest, including changes in the ownership and control of such operators;relinquishmentorsaleofmineralproperties;influenceofmacroeconomicdevelopments;businessopportunitiesthatbecomeavailableto,orarepursuedbyFranco-Nevada;reducedaccesstodebtandequitycapital;litigation;title,permitorlicensedisputesrelatedtointerestsonanyofthepropertiesinwhichFranco-Nevadaholdsaroyalty,streamorotherinterest;whetherornottheCompanyisdeterminedtohave“passiveforeigninvestmentcompany”(“PFIC”)statusasdefinedinSection1297oftheUnitedStatesInternalRevenueCodeof1986,asamended;potentialchangesinCanadiantaxtreatmentofoffshorestreams;excessivecostescalationaswellasdevelopment,permitting,infrastructure,operatingortechnicaldifficultiesonanyofthepropertiesinwhichFranco-Nevadaholdsaroyalty,streamorotherinterest;accesstosufficientpipelinecapacity;actualmineralcontentmaydifferfromthereservesandresourcescontainedintechnicalreports;rateandtimingofproductiondifferencesfromresourceestimates,othertechnicalreportsandmineplans;risksandhazardsassociatedwiththebusinessofdevelopmentandminingonanyofthepropertiesinwhichFranco-Nevadaholdsaroyalty, stream or other interest, including, but not limited to unusual or unexpected geological and metallurgical conditions, slope failures or cave-ins, floodingandothernaturaldisasters,terrorism,civilunrestoranoutbreakofcontagiousdisease;theimpactoftheCOVID-19(coronavirus)pandemic;and the integration of acquired assets. The forward-looking statements contained in this MD&A are based upon assumptions management believes to be reasonable, including, without limitation: the ongoing operation of the properties in which Franco-Nevada holds a royalty, stream or other interest by theownersoroperatorsofsuchpropertiesinamannerconsistentwithpastpractice;theaccuracyofpublicstatementsanddisclosuresmadebytheownersoroperatorsofsuchunderlyingproperties;nomaterialadversechangeinthemarketpriceofthecommoditiesthatunderlietheassetportfolio;theCompany’songoingincomeandassetsrelatingtodeterminationofitsPFICstatus;nomaterialchangestoexistingtaxtreatment;theexpectedapplicationoftaxlawsandregulationsbytaxationauthorities;theexpectedassessmentandoutcomeofanyauditbyanytaxationauthority;noadversedevelopmentinrespectofanysignificantpropertyinwhichFranco-Nevadaholdsaroyalty,streamorotherinterest;theaccuracyofpubliclydisclosedexpectationsforthedevelopmentofunderlyingpropertiesthatarenotyetinproduction;integrationofacquiredassets;andtheabsenceofanyotherfactors that could cause actions, events or results to differ from those anticipated, estimated or intended. However, there can be no assurance that forward-looking statements will prove to be accurate, as actual results and future events could differ materially from those anticipated in such statements. Investors are cautioned that forward-looking statements are not guarantees of future performance. In addition, there can be no assurance as to the outcome of the ongoing audit by the CRA or the Company’s exposure as a result thereof. Franco-Nevada cannot assure investors that actual results will be consistent with these forward-looking statements. Accordingly, investors should not place undue reliance on forward-looking statements due to the inherent uncertainty therein.
For additional information regarding Franco-Nevada’s 2021 and 2025 GEO guidance, please refer to Franco-Nevada’s most recent annual Management’s Discussion and Analysis filed with the Canadian securities regulatory authorities on www.sedar.com and filed with the SEC on www.sec.gov. For additional information with respect to risks, uncertainties and assumptions, please refer to Franco-Nevada’s most recent Annual Information Form filed with the Canadian securities regulatory authorities on www.sedar.com and Franco-Nevada’s most recent Annual Report filed on Form 40-F filed with the SEC on www.sec.gov. The forward-looking statements herein are made as of the date of this MD&A only and Franco-Nevada does not assume any obligation to update or revise them to reflect new information, estimates or opinions, future events or results or otherwise, except as required by applicable law.
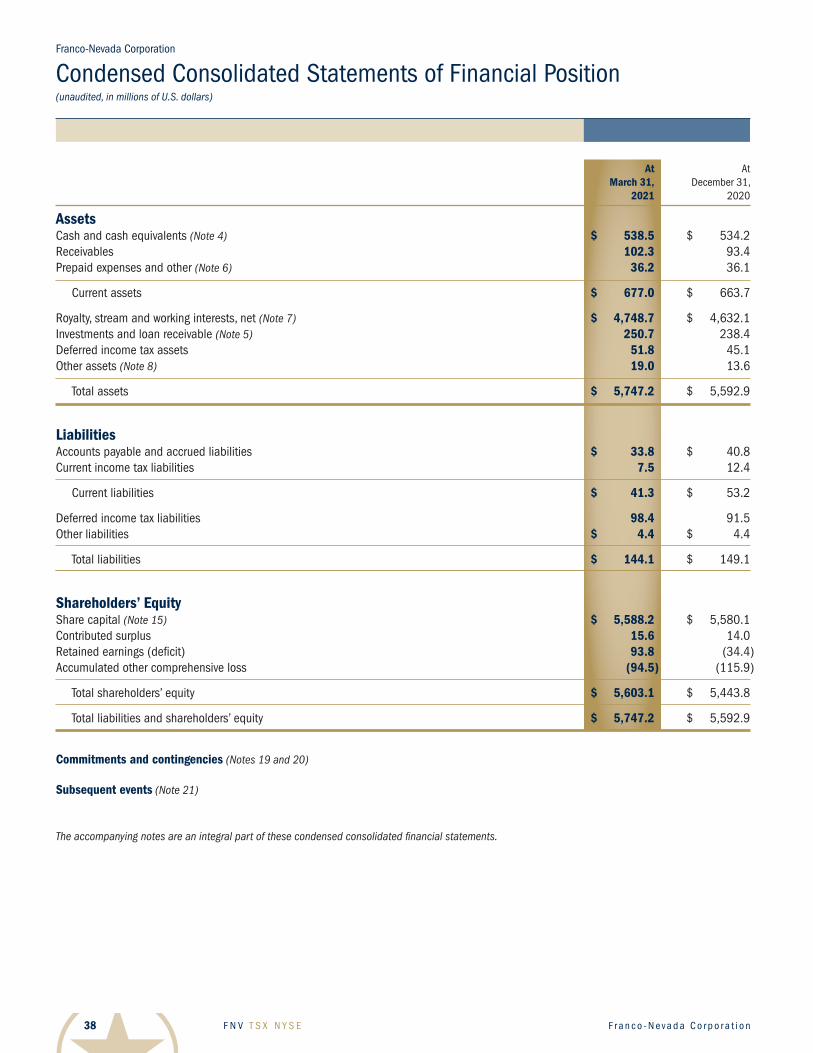
F N V T S X N Y S E F r a n c o - N eva d a C o r p o r a t i o n38
Franco-Nevada Corporation
Condensed Consolidated Statements of Financial Position(unaudited, in millions of U.S. dollars)
At At March 31, December 31, 2021 2020
Assets Cash and cash equivalents (Note 4) $ 538.5 $ 534.2Receivables 102.3 93.4Prepaid expenses and other (Note 6) 36.2 36.1
Current assets $ 677.0 $ 663.7
Royalty, stream and working interests, net (Note 7) $ 4,748.7 $ 4,632.1Investments and loan receivable (Note 5) 250.7 238.4Deferred income tax assets 51.8 45.1Other assets (Note 8) 19.0 13.6
Total assets $ 5,747.2 $ 5,592.9
Liabilities Accounts payable and accrued liabilities $ 33.8 $ 40.8Current income tax liabilities 7.5 12.4
Current liabilities $ 41.3 $ 53.2
Deferred income tax liabilities 98.4 91.5Other liabilities $ 4.4 $ 4.4
Total liabilities $ 144.1 $ 149.1
Shareholders’ Equity Share capital (Note 15) $ 5,588.2 $ 5,580.1Contributed surplus 15.6 14.0Retained earnings (deficit) 93.8 (34.4 )Accumulated other comprehensive loss (94.5) (115.9 )
Total shareholders’ equity $ 5,603.1 $ 5,443.8
Total liabilities and shareholders’ equity $ 5,747.2 $ 5,592.9
Commitments and contingencies (Notes 19 and 20) Subsequent events (Note 21)
The accompanying notes are an integral part of these condensed consolidated financial statements.
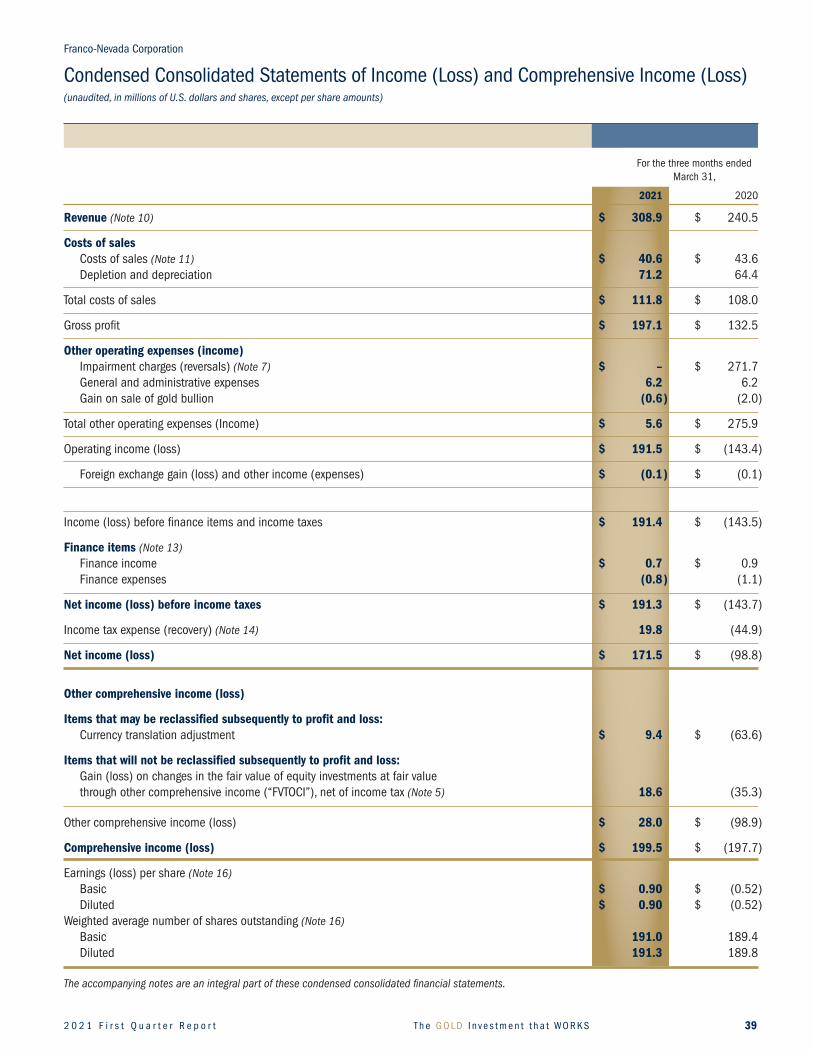
2 0 2 1 F i r s t Q u a r t e r R e p o r t T h e G O L D I nve s t m e n t t h a t WO R K S 39
Franco-Nevada Corporation
Condensed Consolidated Statements of Income (Loss) and Comprehensive Income (Loss)(unaudited, in millions of U.S. dollars and shares, except per share amounts)
For the three months ended March 31,
2021 2020 Revenue (Note 10) $ 308.9 $ 240.5
Costs of sales Costs of sales (Note 11) $ 40.6 $ 43.6 Depletion and depreciation 71.2 64.4
Total costs of sales $ 111.8 $ 108.0
Gross profit $ 197.1 $ 132.5
Otheroperatingexpenses(income) Impairment charges (reversals) (Note 7) $ – $ 271.7 General and administrative expenses 6.2 6.2 Gain on sale of gold bullion (0.6) (2.0 )
Total other operating expenses (Income) $ 5.6 $ 275.9
Operating income (loss) $ 191.5 $ (143.4 )
Foreign exchange gain (loss) and other income (expenses) $ (0.1) $ (0.1 )
Income (loss) before finance items and income taxes $ 191.4 $ (143.5 )
Finance items (Note 13) Finance income $ 0.7 $ 0.9 Finance expenses (0.8) (1.1 )
Netincome(loss)beforeincometaxes $ 191.3 $ (143.7 )
Income tax expense (recovery) (Note 14) 19.8 (44.9 )
Netincome(loss) $ 171.5 $ (98.8 )
Othercomprehensiveincome(loss)
Items that may be reclassified subsequently to profit and loss: Currency translation adjustment $ 9.4 $ (63.6 )
Items that will not be reclassified subsequently to profit and loss: Gain (loss) on changes in the fair value of equity investments at fair value through other comprehensive income (“FVTOCI”), net of income tax (Note 5) 18.6 (35.3 )
Other comprehensive income (loss) $ 28.0 $ (98.9 )
Comprehensiveincome(loss) $ 199.5 $ (197.7 )
Earnings (loss) per share (Note 16) Basic $ 0.90 $ (0.52 ) Diluted $ 0.90 $ (0.52 ) Weighted average number of shares outstanding (Note 16) Basic 191.0 189.4 Diluted 191.3 189.8
The accompanying notes are an integral part of these condensed consolidated financial statements.
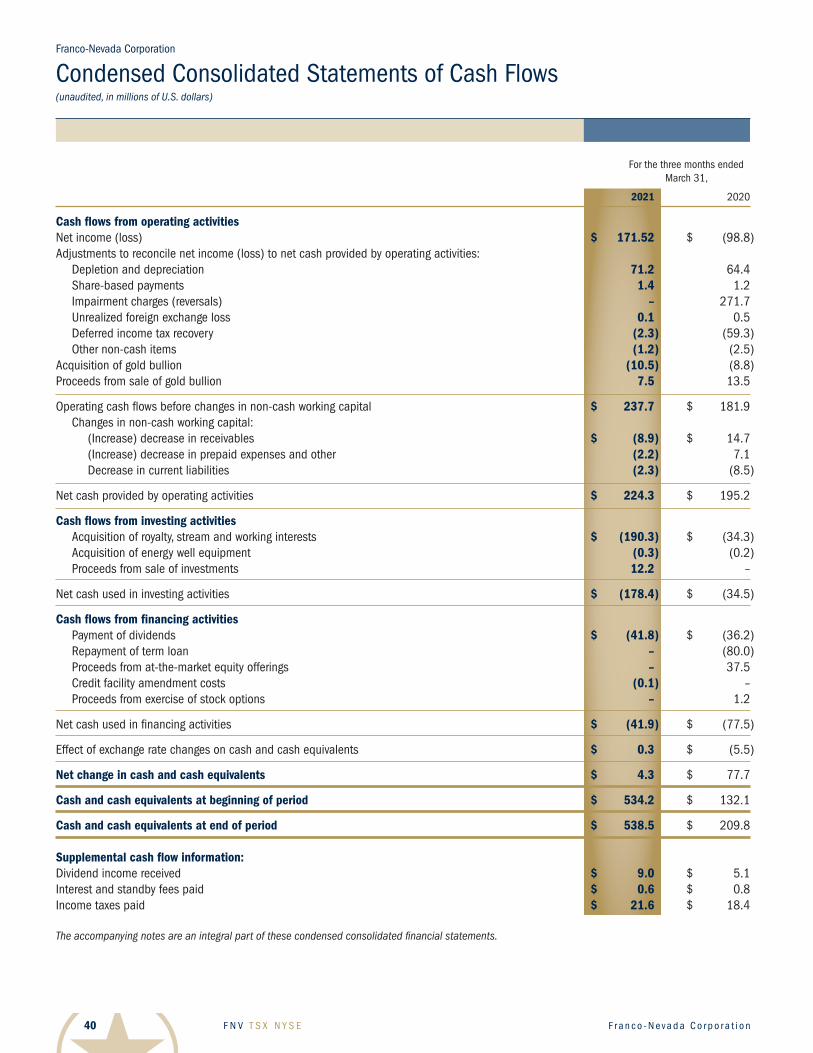
F N V T S X N Y S E F r a n c o - N eva d a C o r p o r a t i o n40
For the three months ended March 31,
2021 2020
Cash flows from operating activitiesNet income (loss) $ 171.52 $ (98.8 )Adjustments to reconcile net income (loss) to net cash provided by operating activities: Depletion and depreciation 71.2 64.4 Share-based payments 1.4 1.2 Impairment charges (reversals) – 271.7 Unrealized foreign exchange loss 0.1 0.5 Deferred income tax recovery (2.3) (59.3 ) Other non-cash items (1.2) (2.5 )Acquisition of gold bullion (10.5) (8.8 )Proceeds from sale of gold bullion 7.5 13.5
Operating cash flows before changes in non-cash working capital $ 237.7 $ 181.9 Changes in non-cash working capital: (Increase) decrease in receivables $ (8.9) $ 14.7 (Increase) decrease in prepaid expenses and other (2.2) 7.1 Decrease in current liabilities (2.3) (8.5 )
Net cash provided by operating activities $ 224.3 $ 195.2
Cash flows from investing activities Acquisition of royalty, stream and working interests $ (190.3) $ (34.3 ) Acquisition of energy well equipment (0.3) (0.2 ) Proceeds from sale of investments 12.2 –
Net cash used in investing activities $ (178.4) $ (34.5 )
Cash flows from financing activities Payment of dividends $ (41.8) $ (36.2 ) Repayment of term loan – (80.0 ) Proceeds from at-the-market equity offerings – 37.5 Credit facility amendment costs (0.1) – Proceeds from exercise of stock options – 1.2
Net cash used in financing activities $ (41.9) $ (77.5 )
Effect of exchange rate changes on cash and cash equivalents $ 0.3 $ (5.5 )
Net change in cash and cash equivalents $ 4.3 $ 77.7
Cash and cash equivalents at beginning of period $ 534.2 $ 132.1
Cash and cash equivalents at end of period $ 538.5 $ 209.8
Supplemental cash flow information: Dividend income received $ 9.0 $ 5.1Interest and standby fees paid $ 0.6 $ 0.8Income taxes paid $ 21.6 $ 18.4
The accompanying notes are an integral part of these condensed consolidated financial statements.
Franco-Nevada Corporation
Condensed Consolidated Statements of Cash Flows(unaudited, in millions of U.S. dollars)
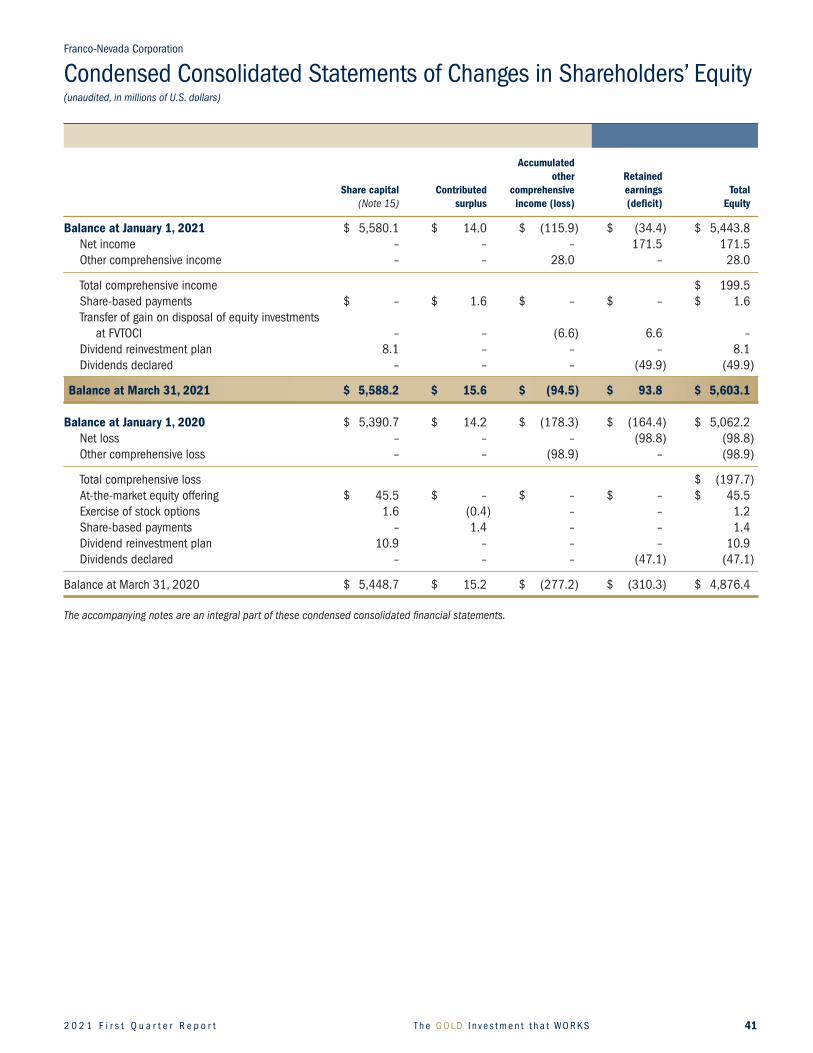
2 0 2 1 F i r s t Q u a r t e r R e p o r t T h e G O L D I nve s t m e n t t h a t WO R K S 41
Accumulated other Retained Sharecapital Contributed comprehensive earnings Total (Note 15) surplus income(loss) (deficit) Equity
BalanceatJanuary1,2021 $ 5,580.1 $ 14.0 $ (115.9 ) $ (34.4 ) $ 5,443.8 Net income – – – 171.5 171.5 Other comprehensive income – – 28.0 – 28.0
Total comprehensive income $ 199.5 Share-based payments $ – $ 1.6 $ – $ – $ 1.6 Transfer of gain on disposal of equity investments at FVTOCI – – (6.6 ) 6.6 – Dividend reinvestment plan 8.1 – – – 8.1 Dividends declared – – – (49.9 ) (49.9 )
BalanceatMarch31,2021 $ 5,588.2 $ 15.6 $ (94.5) $ 93.8 $ 5,603.1
BalanceatJanuary1,2020 $ 5,390.7 $ 14.2 $ (178.3 ) $ (164.4 ) $ 5,062.2 Net loss – – – (98.8 ) (98.8 ) Other comprehensive loss – – (98.9 ) – (98.9 )
Total comprehensive loss $ (197.7 ) At-the-market equity offering $ 45.5 $ – $ – $ – $ 45.5 Exercise of stock options 1.6 (0.4 ) – – 1.2 Share-based payments – 1.4 – – 1.4 Dividend reinvestment plan 10.9 – – – 10.9 Dividends declared – – – (47.1 ) (47.1 )
Balance at March 31, 2020 $ 5,448.7 $ 15.2 $ (277.2 ) $ (310.3 ) $ 4,876.4
The accompanying notes are an integral part of these condensed consolidated financial statements.
Franco-Nevada Corporation
Condensed Consolidated Statements of Changes in Shareholders’ Equity (unaudited, in millions of U.S. dollars)
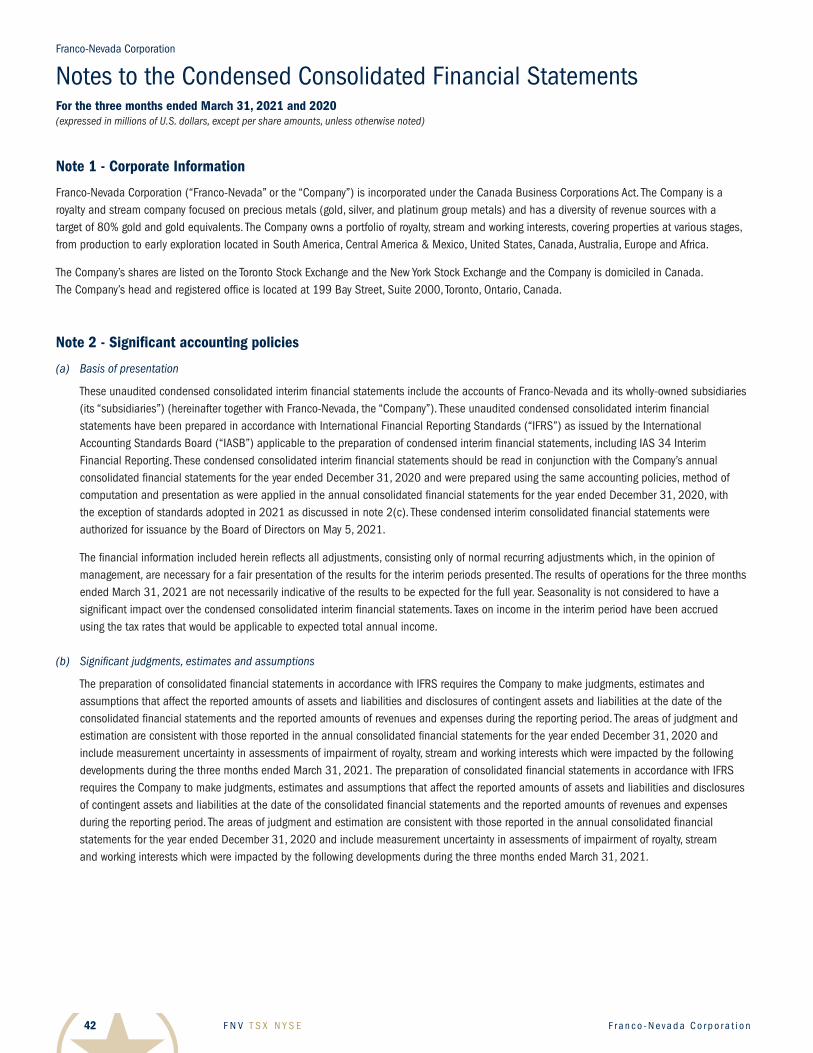
F N V T S X N Y S E F r a n c o - N eva d a C o r p o r a t i o n42
Note 1 - Corporate Information
Franco-Nevada Corporation (“Franco-Nevada” or the “Company”) is incorporated under the Canada Business Corporations Act. The Company is a royalty and stream company focused on precious metals (gold, silver, and platinum group metals) and has a diversity of revenue sources with a target of 80% gold and gold equivalents. The Company owns a portfolio of royalty, stream and working interests, covering properties at various stages, from production to early exploration located in South America, Central America & Mexico, United States, Canada, Australia, Europe and Africa.
The Company’s shares are listed on the Toronto Stock Exchange and the New York Stock Exchange and the Company is domiciled in Canada. The Company’s head and registered office is located at 199 Bay Street, Suite 2000, Toronto, Ontario, Canada.
Note 2 - Significant accounting policies
(a) Basis of presentation
These unaudited condensed consolidated interim financial statements include the accounts of Franco-Nevada and its wholly-owned subsidiaries (its “subsidiaries”) (hereinafter together with Franco-Nevada, the “Company”). These unaudited condensed consolidated interim financial statements have been prepared in accordance with International Financial Reporting Standards (“IFRS”) as issued by the International Accounting Standards Board (“IASB”) applicable to the preparation of condensed interim financial statements, including IAS 34 Interim Financial Reporting. These condensed consolidated interim financial statements should be read in conjunction with the Company’s annual consolidated financial statements for the year ended December 31, 2020 and were prepared using the same accounting policies, method of computation and presentation as were applied in the annual consolidated financial statements for the year ended December 31, 2020, with the exception of standards adopted in 2021 as discussed in note 2(c). These condensed interim consolidated financial statements were authorized for issuance by the Board of Directors on May 5, 2021.
The financial information included herein reflects all adjustments, consisting only of normal recurring adjustments which, in the opinion of management, are necessary for a fair presentation of the results for the interim periods presented. The results of operations for the three months ended March 31, 2021 are not necessarily indicative of the results to be expected for the full year. Seasonality is not considered to have a significant impact over the condensed consolidated interim financial statements. Taxes on income in the interim period have been accrued using the tax rates that would be applicable to expected total annual income.
(b) Significant judgments, estimates and assumptions
The preparation of consolidated financial statements in accordance with IFRS requires the Company to make judgments, estimates and assumptions that affect the reported amounts of assets and liabilities and disclosures of contingent assets and liabilities at the date of the consolidated financial statements and the reported amounts of revenues and expenses during the reporting period. The areas of judgment and estimation are consistent with those reported in the annual consolidated financial statements for the year ended December 31, 2020 and include measurement uncertainty in assessments of impairment of royalty, stream and working interests which were impacted by the following developments during the three months ended March 31, 2021. The preparation of consolidated financial statements in accordance with IFRS requires the Company to make judgments, estimates and assumptions that affect the reported amounts of assets and liabilities and disclosures of contingent assets and liabilities at the date of the consolidated financial statements and the reported amounts of revenues and expenses during the reporting period. The areas of judgment and estimation are consistent with those reported in the annual consolidated financial statements for the year ended December 31, 2020 and include measurement uncertainty in assessments of impairment of royalty, stream and working interests which were impacted by the following developments during the three months ended March 31, 2021.
Franco-Nevada Corporation
Notes to the Condensed Consolidated Financial StatementsFor the three months ended March 31, 2021 and 2020(expressed in millions of U.S. dollars, except per share amounts, unless otherwise noted)
2 0 2 1 F i r s t Q u a r t e r R e p o r t T h e G O L D I nve s t m e n t t h a t WO R K S 43
Impact of the COVID-19 pandemic
The COVID-19 global health pandemic has had a significant impact on the global economy and commodity and financial markets. The full extent and impact of the COVID-19 pandemic is unknown. The adverse effects of the pandemic may continue for an extended and unknown period of time, particularly as variant strains of the virus are identified. The impact of the pandemic to date has included extreme volatility in financial markets, a slowdown in economic activity, extreme volatility in commodity prices (including gold, silver, palladium and oil and gas). As well, as efforts have been undertaken to slow the spread of the COVID-19 pandemic, the operation and development of mining projects has been impacted. Many mining projects, including a number of the properties in which Franco-Nevada holds a royalty, stream or other interest have been impacted by the pandemic resulting in the temporary suspension of operations, and other mitigation measures that impacted production. If the operation or development of one or more of the properties in which Franco-Nevada holds a royalty, stream or other interest and from which it receives or expects to receive significant revenue is suspended as a result of the continuing COVID-19 pandemic or future pandemics or other public health emergencies, it may have a material adverse impact on Franco-Nevada’s profitability, results of operations, financial condition and the trading price of Franco-Nevada’s securities. The broader impact of the COVID-19 pandemic or future pandemics or similar public health emergencies on investors, businesses, the global economy or financial and commodity markets may also have a material adverse impact on Franco-Nevada’s profitability, results of operations, financial condition and the trading price of Franco-Nevada’s securities.
(c) New and amended standards adopted by the Company
The following standard was effective and implemented for the annual period as of January 1, 2021.
Interest rate benchmark reform
In 2020, the IASB published Interest Rate Benchmark Reform - Phase 2 (Amendments to IFRS 9, IAS 39, IFRS 7, IFRS 4, and IFRS 16) (“Phase 2 amendments”) to address the financial reporting impacts of replacing one benchmark interest rate with an alternative rate. The Phase 2 amendments provide a practical expedient to ease the potential burden of accounting for changes in contractual cash flows and include disclosure requirements at the time of benchmark interest rate replacement. The Company has adopted these Phase 2 amendments effective January 1, 2021 and has applied the Phase 2 amendments retrospectively. There was no significant impact to the current period or comparative periods presented as a result of the Phase 2 amendments.
Note 3 - Acquisitions and other transactions
(a) Acquisition of Séguéla Royalty - Côte d’Ivoire
On March 30, 2021, the Company acquired a 1.2% NSR on Roxgold Inc.’s (“Roxgold”) Séguéla gold project in Côte d’Ivoire for $15.2 million (A$20.0 million). The royalty agreement is subject to a buy-back at the option of Roxgold of up to 50% of the royalty at a pro rata portion of the purchase price for a period of up to three years after closing.
The acquisition of the Séguéla royalty has been accounted for as an asset acquisition.
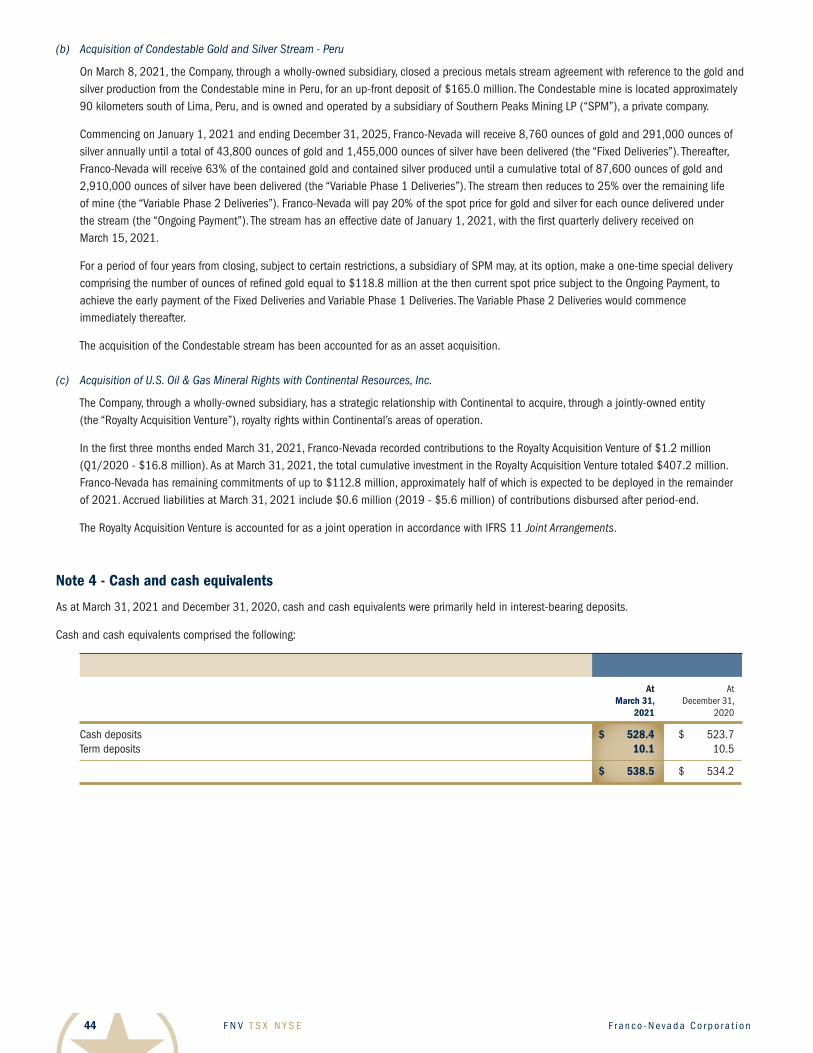
F N V T S X N Y S E F r a n c o - N eva d a C o r p o r a t i o n44
(b) Acquisition of Condestable Gold and Silver Stream - Peru
On March 8, 2021, the Company, through a wholly-owned subsidiary, closed a precious metals stream agreement with reference to the gold and silver production from the Condestable mine in Peru, for an up-front deposit of $165.0 million. The Condestable mine is located approximately 90 kilometers south of Lima, Peru, and is owned and operated by a subsidiary of Southern Peaks Mining LP (“SPM”), a private company.
Commencing on January 1, 2021 and ending December 31, 2025, Franco-Nevada will receive 8,760 ounces of gold and 291,000 ounces of silver annually until a total of 43,800 ounces of gold and 1,455,000 ounces of silver have been delivered (the “Fixed Deliveries”). Thereafter, Franco-Nevada will receive 63% of the contained gold and contained silver produced until a cumulative total of 87,600 ounces of gold and 2,910,000 ounces of silver have been delivered (the “Variable Phase 1 Deliveries”). The stream then reduces to 25% over the remaining life of mine (the “Variable Phase 2 Deliveries”). Franco-Nevada will pay 20% of the spot price for gold and silver for each ounce delivered under the stream (the “Ongoing Payment”). The stream has an effective date of January 1, 2021, with the first quarterly delivery received on March 15, 2021.
For a period of four years from closing, subject to certain restrictions, a subsidiary of SPM may, at its option, make a one-time special delivery comprising the number of ounces of refined gold equal to $118.8 million at the then current spot price subject to the Ongoing Payment, to achieve the early payment of the Fixed Deliveries and Variable Phase 1 Deliveries. The Variable Phase 2 Deliveries would commence immediately thereafter.
The acquisition of the Condestable stream has been accounted for as an asset acquisition.
(c) Acquisition of U.S. Oil & Gas Mineral Rights with Continental Resources, Inc.
The Company, through a wholly-owned subsidiary, has a strategic relationship with Continental to acquire, through a jointly-owned entity (the “Royalty Acquisition Venture”), royalty rights within Continental’s areas of operation.
In the first three months ended March 31, 2021, Franco-Nevada recorded contributions to the Royalty Acquisition Venture of $1.2 million (Q1/2020 - $16.8 million). As at March 31, 2021, the total cumulative investment in the Royalty Acquisition Venture totaled $407.2 million. Franco-Nevada has remaining commitments of up to $112.8 million, approximately half of which is expected to be deployed in the remainder of 2021. Accrued liabilities at March 31, 2021 include $0.6 million (2019 - $5.6 million) of contributions disbursed after period-end.
The Royalty Acquisition Venture is accounted for as a joint operation in accordance with IFRS 11 Joint Arrangements.
Note 4 - Cash and cash equivalents
As at March 31, 2021 and December 31, 2020, cash and cash equivalents were primarily held in interest-bearing deposits.
Cash and cash equivalents comprised the following:
At At March 31, December 31, 2021 2020
Cash deposits $ 528.4 $ 523.7Term deposits 10.1 10.5
$ 538.5 $ 534.2
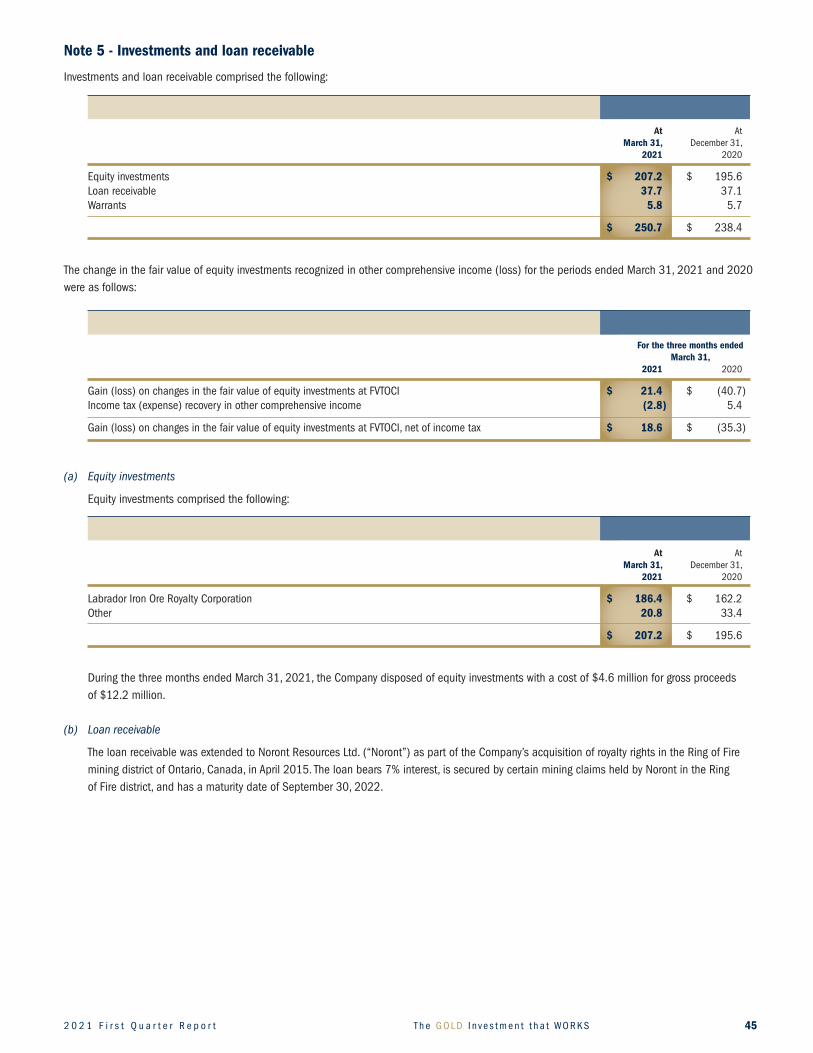
2 0 2 1 F i r s t Q u a r t e r R e p o r t T h e G O L D I nve s t m e n t t h a t WO R K S 45
Note 5 - Investments and loan receivable
Investments and loan receivable comprised the following:
At At March 31, December 31, 2021 2020
Equity investments $ 207.2 $ 195.6Loan receivable 37.7 37.1Warrants 5.8 5.7
$ 250.7 $ 238.4
The change in the fair value of equity investments recognized in other comprehensive income (loss) for the periods ended March 31, 2021 and 2020 were as follows:
For the three months ended March 31, 2021 2020
Gain (loss) on changes in the fair value of equity investments at FVTOCI $ 21.4 $ (40.7 )Income tax (expense) recovery in other comprehensive income (2.8) 5.4
Gain (loss) on changes in the fair value of equity investments at FVTOCI, net of income tax $ 18.6 $ (35.3 )
(a) Equity investments
Equity investments comprised the following:
At At March 31, December 31, 2021 2020
Labrador Iron Ore Royalty Corporation $ 186.4 $ 162.2Other 20.8 33.4
$ 207.2 $ 195.6
During the three months ended March 31, 2021, the Company disposed of equity investments with a cost of $4.6 million for gross proceeds of $12.2 million.
(b) Loan receivable
The loan receivable was extended to Noront Resources Ltd. (“Noront”) as part of the Company’s acquisition of royalty rights in the Ring of Fire mining district of Ontario, Canada, in April 2015. The loan bears 7% interest, is secured by certain mining claims held by Noront in the Ring of Fire district, and has a maturity date of September 30, 2022.
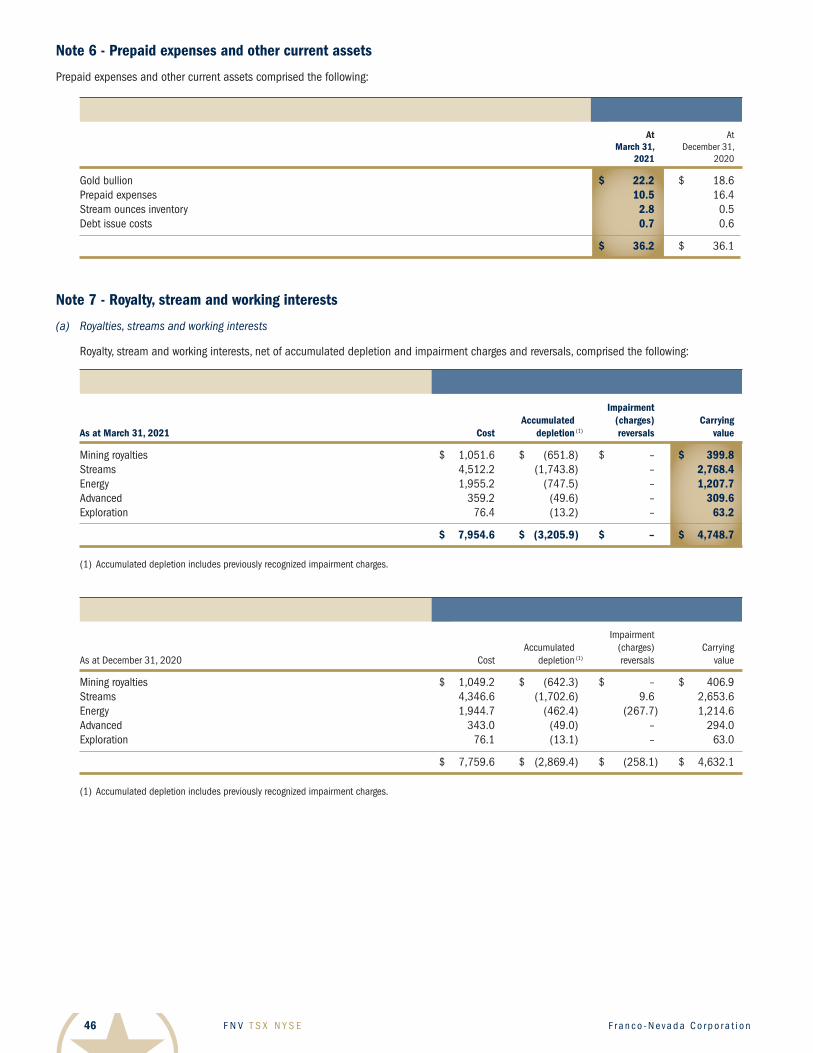
F N V T S X N Y S E F r a n c o - N eva d a C o r p o r a t i o n46
Note 6 - Prepaid expenses and other current assets
Prepaid expenses and other current assets comprised the following:
At At March 31, December 31, 2021 2020
Gold bullion $ 22.2 $ 18.6Prepaid expenses 10.5 16.4Stream ounces inventory 2.8 0.5Debt issue costs 0.7 0.6
$ 36.2 $ 36.1
Note 7 - Royalty, stream and working interests
(a) Royalties, streams and working interests
Royalty, stream and working interests, net of accumulated depletion and impairment charges and reversals, comprised the following:
Impairment Accumulated (charges) CarryingAs at March 31, 2021 Cost depletion (1) reversals value
Mining royalties $ 1,051.6 $ (651.8 ) $ – $ 399.8Streams 4,512.2 (1,743.8 ) – 2,768.4Energy 1,955.2 (747.5 ) – 1,207.7Advanced 359.2 (49.6 ) – 309.6Exploration 76.4 (13.2 ) – 63.2
$ 7,954.6 $ (3,205.9) $ – $ 4,748.7
(1) Accumulated depletion includes previously recognized impairment charges.
Impairment Accumulated (charges) CarryingAs at December 31, 2020 Cost depletion (1) reversals value
Mining royalties $ 1,049.2 $ (642.3 ) $ – $ 406.9Streams 4,346.6 (1,702.6 ) 9.6 2,653.6Energy 1,944.7 (462.4 ) (267.7 ) 1,214.6Advanced 343.0 (49.0 ) – 294.0Exploration 76.1 (13.1 ) – 63.0
$ 7,759.6 $ (2,869.4 ) $ (258.1 ) $ 4,632.1
(1) Accumulated depletion includes previously recognized impairment charges.
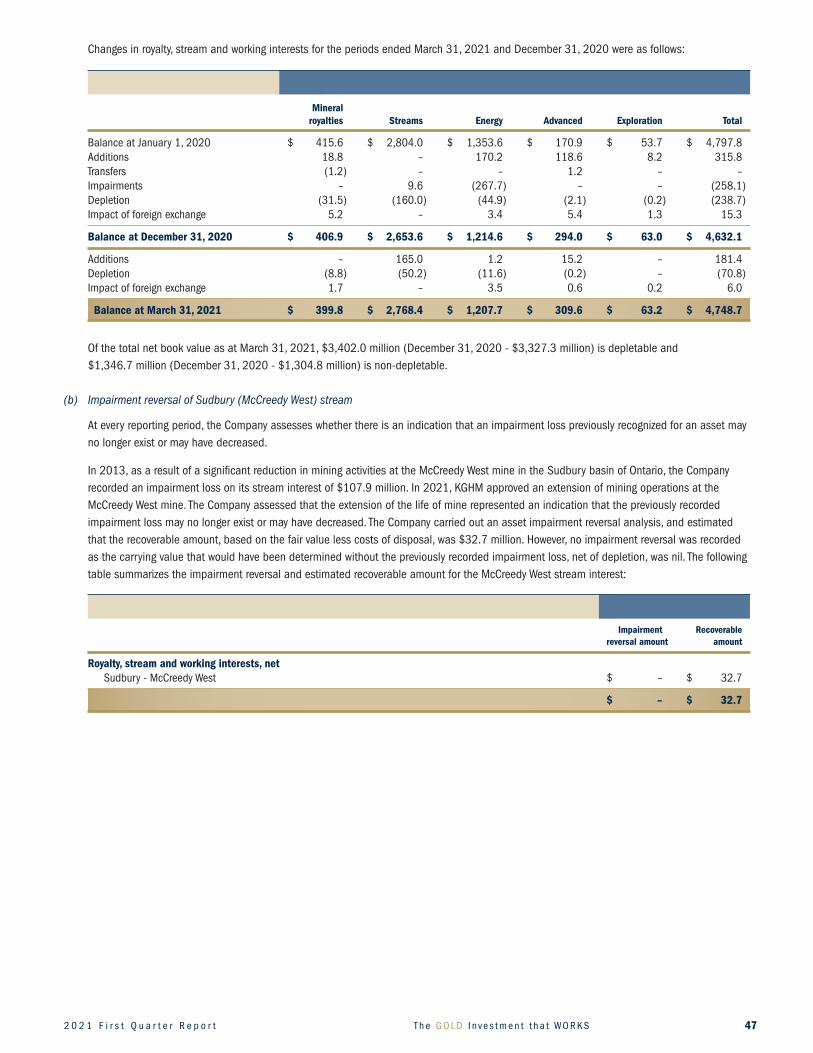
2 0 2 1 F i r s t Q u a r t e r R e p o r t T h e G O L D I nve s t m e n t t h a t WO R K S 47
Changes in royalty, stream and working interests for the periods ended March 31, 2021 and December 31, 2020 were as follows:
Mineral royalties Streams Energy Advanced Exploration Total
Balance at January 1, 2020 $ 415.6 $ 2,804.0 $ 1,353.6 $ 170.9 $ 53.7 $ 4,797.8Additions 18.8 – 170.2 118.6 8.2 315.8Transfers (1.2 ) – – 1.2 – –Impairments – 9.6 (267.7 ) – – (258.1 )Depletion (31.5 ) (160.0 ) (44.9 ) (2.1 ) (0.2 ) (238.7 )Impact of foreign exchange 5.2 – 3.4 5.4 1.3 15.3
BalanceatDecember31,2020 $ 406.9 $ 2,653.6 $ 1,214.6 $ 294.0 $ 63.0 $ 4,632.1
Additions – 165.0 1.2 15.2 – 181.4Depletion (8.8 ) (50.2 ) (11.6 ) (0.2 ) – (70.8 )Impact of foreign exchange 1.7 – 3.5 0.6 0.2 6.0
BalanceatMarch31,2021 $ 399.8 $ 2,768.4 $ 1,207.7 $ 309.6 $ 63.2 $ 4,748.7
Of the total net book value as at March 31, 2021, $3,402.0 million (December 31, 2020 - $3,327.3 million) is depletable and $1,346.7 million (December 31, 2020 - $1,304.8 million) is non-depletable.
(b) Impairment reversal of Sudbury (McCreedy West) stream
At every reporting period, the Company assesses whether there is an indication that an impairment loss previously recognized for an asset may no longer exist or may have decreased.
In 2013, as a result of a significant reduction in mining activities at the McCreedy West mine in the Sudbury basin of Ontario, the Company recorded an impairment loss on its stream interest of $107.9 million. In 2021, KGHM approved an extension of mining operations at the McCreedy West mine. The Company assessed that the extension of the life of mine represented an indication that the previously recorded impairment loss may no longer exist or may have decreased. The Company carried out an asset impairment reversal analysis, and estimated that the recoverable amount, based on the fair value less costs of disposal, was $32.7 million. However, no impairment reversal was recorded as the carrying value that would have been determined without the previously recorded impairment loss, net of depletion, was nil. The following table summarizes the impairment reversal and estimated recoverable amount for the McCreedy West stream interest:
Impairment Recoverable reversal amount amount
Royalty, stream and working interests, net Sudbury - McCreedy West $ – $ 32.7
$ – $ 32.7
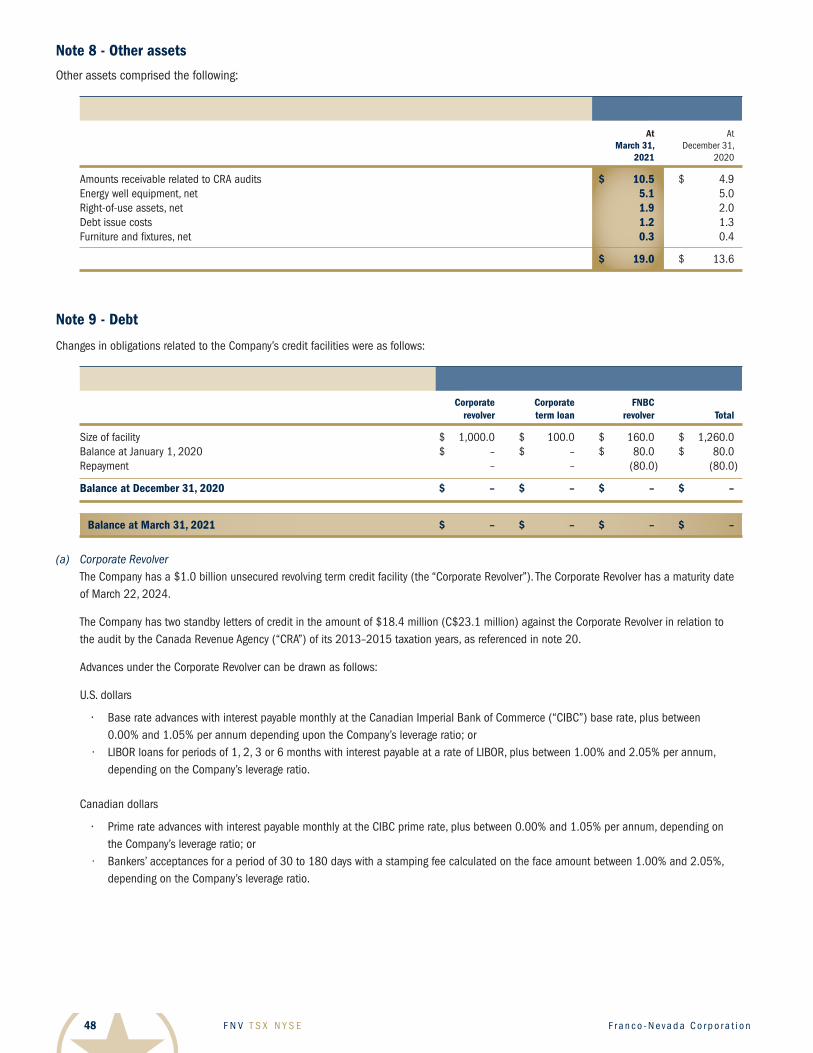
F N V T S X N Y S E F r a n c o - N eva d a C o r p o r a t i o n48
Note 8 - Other assets
Other assets comprised the following:
At At March 31, December 31, 2021 2020
Amounts receivable related to CRA audits $ 10.5 $ 4.9Energy well equipment, net 5.1 5.0Right-of-use assets, net 1.9 2.0Debt issue costs 1.2 1.3Furniture and fixtures, net 0.3 0.4
$ 19.0 $ 13.6
Note 9 - Debt
Changes in obligations related to the Company’s credit facilities were as follows:
Corporate Corporate FNBC revolver termloan revolver Total
Size of facility $ 1,000.0 $ 100.0 $ 160.0 $ 1,260.0Balance at January 1, 2020 $ – $ – $ 80.0 $ 80.0Repayment – – (80.0 ) (80.0 )
BalanceatDecember31,2020 $ – $ – $ – $ –
BalanceatMarch31,2021 $ – $ – $ – $ –
(a) Corporate Revolver The Company has a $1.0 billion unsecured revolving term credit facility (the “Corporate Revolver”). The Corporate Revolver has a maturity date of March 22, 2024.
The Company has two standby letters of credit in the amount of $18.4 million (C$23.1 million) against the Corporate Revolver in relation to the audit by the Canada Revenue Agency (“CRA”) of its 2013–2015 taxation years, as referenced in note 20.
Advances under the Corporate Revolver can be drawn as follows:
U.S. dollars
• BaserateadvanceswithinterestpayablemonthlyattheCanadianImperialBankofCommerce(“CIBC”)baserate,plusbetween 0.00%and1.05%perannumdependingupontheCompany’sleverageratio;or
· LIBOR loans for periods of 1, 2, 3 or 6 months with interest payable at a rate of LIBOR, plus between 1.00% and 2.05% per annum, depending on the Company’s leverage ratio.
Canadian dollars
• PrimerateadvanceswithinterestpayablemonthlyattheCIBCprimerate,plusbetween0.00%and1.05%perannum,dependingon theCompany’sleverageratio;or
· Bankers’ acceptances for a period of 30 to 180 days with a stamping fee calculated on the face amount between 1.00% and 2.05%, depending on the Company’s leverage ratio.
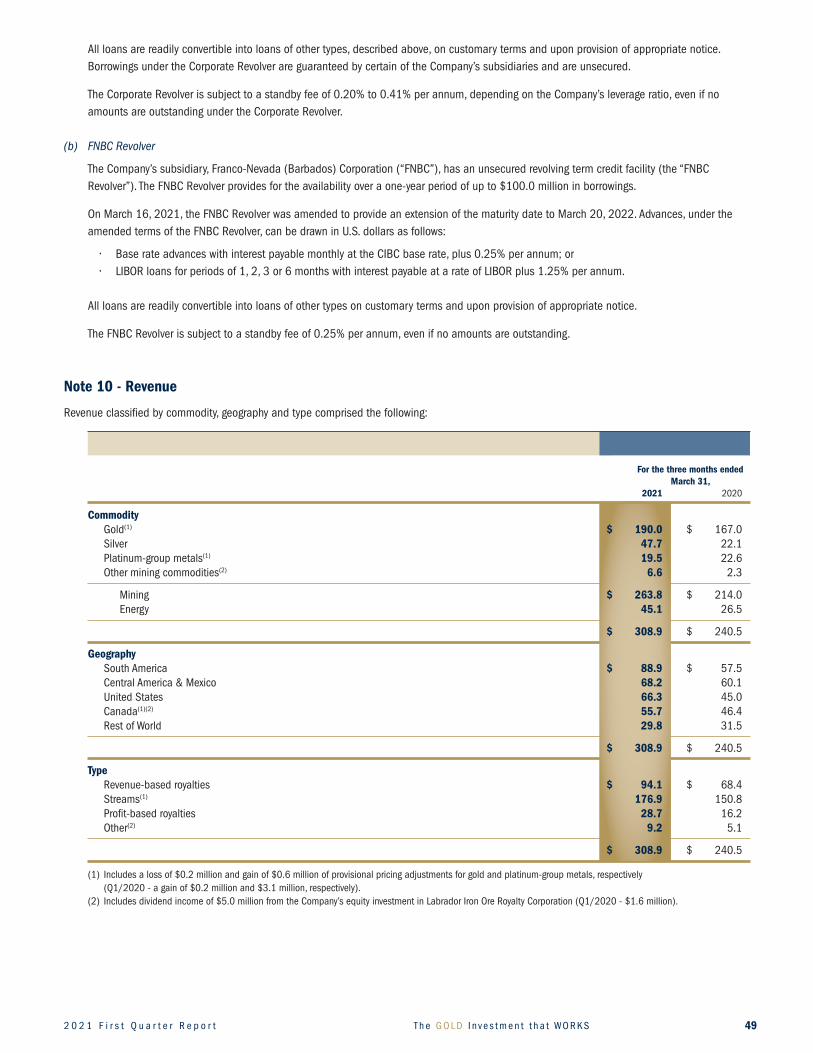
2 0 2 1 F i r s t Q u a r t e r R e p o r t T h e G O L D I nve s t m e n t t h a t WO R K S 49
All loans are readily convertible into loans of other types, described above, on customary terms and upon provision of appropriate notice. Borrowings under the Corporate Revolver are guaranteed by certain of the Company’s subsidiaries and are unsecured.
The Corporate Revolver is subject to a standby fee of 0.20% to 0.41% per annum, depending on the Company’s leverage ratio, even if no amounts are outstanding under the Corporate Revolver.
(b) FNBC Revolver
The Company’s subsidiary, Franco-Nevada (Barbados) Corporation (“FNBC”), has an unsecured revolving term credit facility (the “FNBC Revolver”). The FNBC Revolver provides for the availability over a one-year period of up to $100.0 million in borrowings.
On March 16, 2021, the FNBC Revolver was amended to provide an extension of the maturity date to March 20, 2022. Advances, under the amended terms of the FNBC Revolver, can be drawn in U.S. dollars as follows:
• BaserateadvanceswithinterestpayablemonthlyattheCIBCbaserate,plus0.25%perannum;or• LIBORloansforperiodsof1,2,3or6monthswithinterestpayableatarateofLIBORplus1.25%perannum.
All loans are readily convertible into loans of other types on customary terms and upon provision of appropriate notice.
The FNBC Revolver is subject to a standby fee of 0.25% per annum, even if no amounts are outstanding.
Note 10 - Revenue
Revenue classified by commodity, geography and type comprised the following:
For the three months ended March 31, 2021 2020
Commodity Gold(1) $ 190.0 $ 167.0 Silver 47.7 22.1 Platinum-group metals(1) 19.5 22.6 Other mining commodities(2) 6.6 2.3
Mining $ 263.8 $ 214.0 Energy 45.1 26.5
$ 308.9 $ 240.5
Geography South America $ 88.9 $ 57.5 Central America & Mexico 68.2 60.1 United States 66.3 45.0 Canada(1)(2) 55.7 46.4 Rest of World 29.8 31.5
$ 308.9 $ 240.5
Type Revenue-based royalties $ 94.1 $ 68.4 Streams(1) 176.9 150.8 Profit-based royalties 28.7 16.2 Other(2) 9.2 5.1
$ 308.9 $ 240.5
(1) Includes a loss of $0.2 million and gain of $0.6 million of provisional pricing adjustments for gold and platinum-group metals, respectively (Q1/2020 - a gain of $0.2 million and $3.1 million, respectively).(2) Includes dividend income of $5.0 million from the Company’s equity investment in Labrador Iron Ore Royalty Corporation (Q1/2020 - $1.6 million).
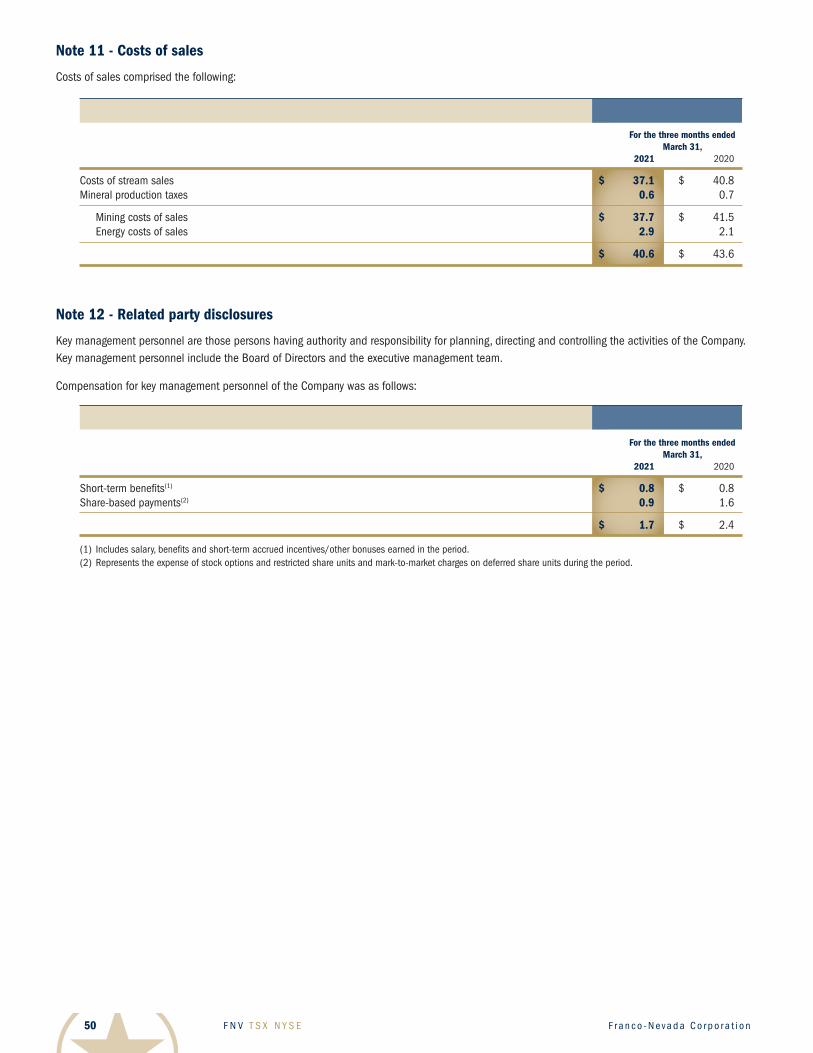
F N V T S X N Y S E F r a n c o - N eva d a C o r p o r a t i o n50
Note 11 - Costs of sales
Costs of sales comprised the following:
For the three months ended March 31, 2021 2020
Costs of stream sales $ 37.1 $ 40.8Mineral production taxes 0.6 0.7
Mining costs of sales $ 37.7 $ 41.5 Energy costs of sales 2.9 2.1
$ 40.6 $ 43.6
Note 12 - Related party disclosures
Key management personnel are those persons having authority and responsibility for planning, directing and controlling the activities of the Company. Key management personnel include the Board of Directors and the executive management team.
Compensation for key management personnel of the Company was as follows:
For the three months ended March 31, 2021 2020
Short-term benefits(1) $ 0.8 $ 0.8Share-based payments(2) 0.9 1.6
$ 1.7 $ 2.4
(1) Includes salary, benefits and short-term accrued incentives/other bonuses earned in the period.(2) Represents the expense of stock options and restricted share units and mark-to-market charges on deferred share units during the period.
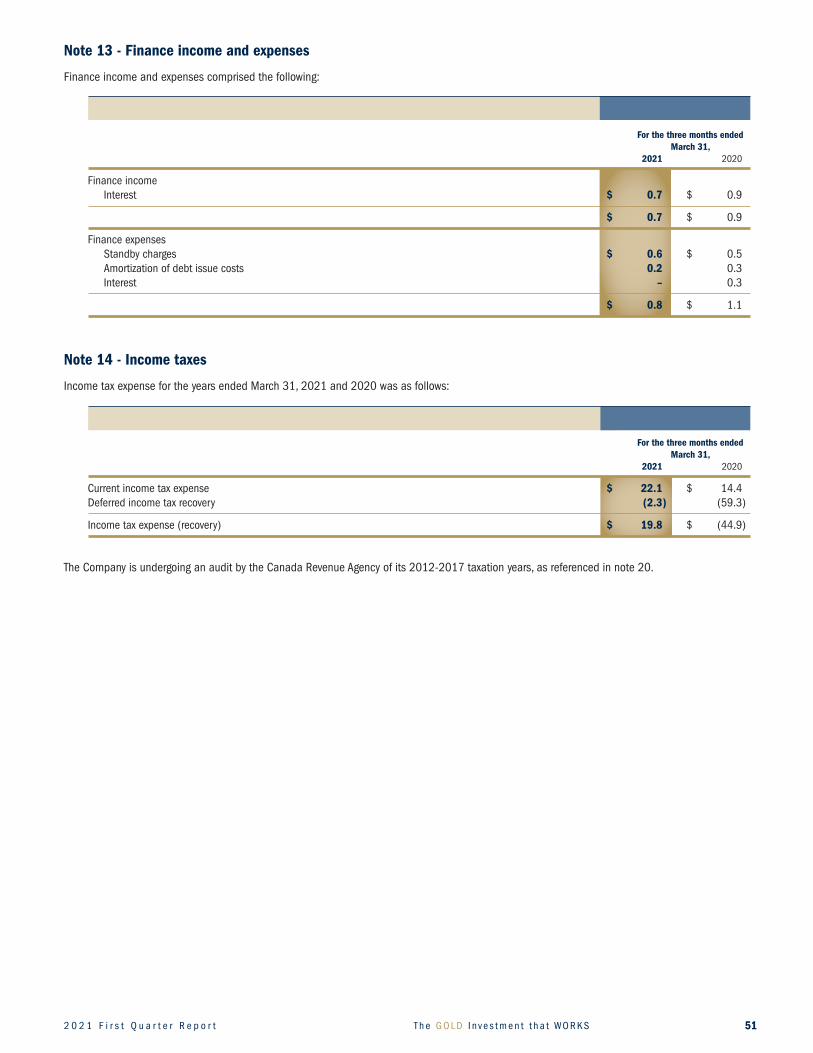
2 0 2 1 F i r s t Q u a r t e r R e p o r t T h e G O L D I nve s t m e n t t h a t WO R K S 51
Note 13 - Finance income and expenses
Finance income and expenses comprised the following:
For the three months ended March 31, 2021 2020
Finance income Interest $ 0.7 $ 0.9
$ 0.7 $ 0.9
Finance expenses Standby charges $ 0.6 $ 0.5 Amortization of debt issue costs 0.2 0.3 Interest – 0.3
$ 0.8 $ 1.1
Note 14 - Income taxes
Income tax expense for the years ended March 31, 2021 and 2020 was as follows:
For the three months ended March 31, 2021 2020
Current income tax expense $ 22.1 $ 14.4Deferred income tax recovery (2.3) (59.3 )
Income tax expense (recovery) $ 19.8 $ (44.9 )
The Company is undergoing an audit by the Canada Revenue Agency of its 2012-2017 taxation years, as referenced in note 20.
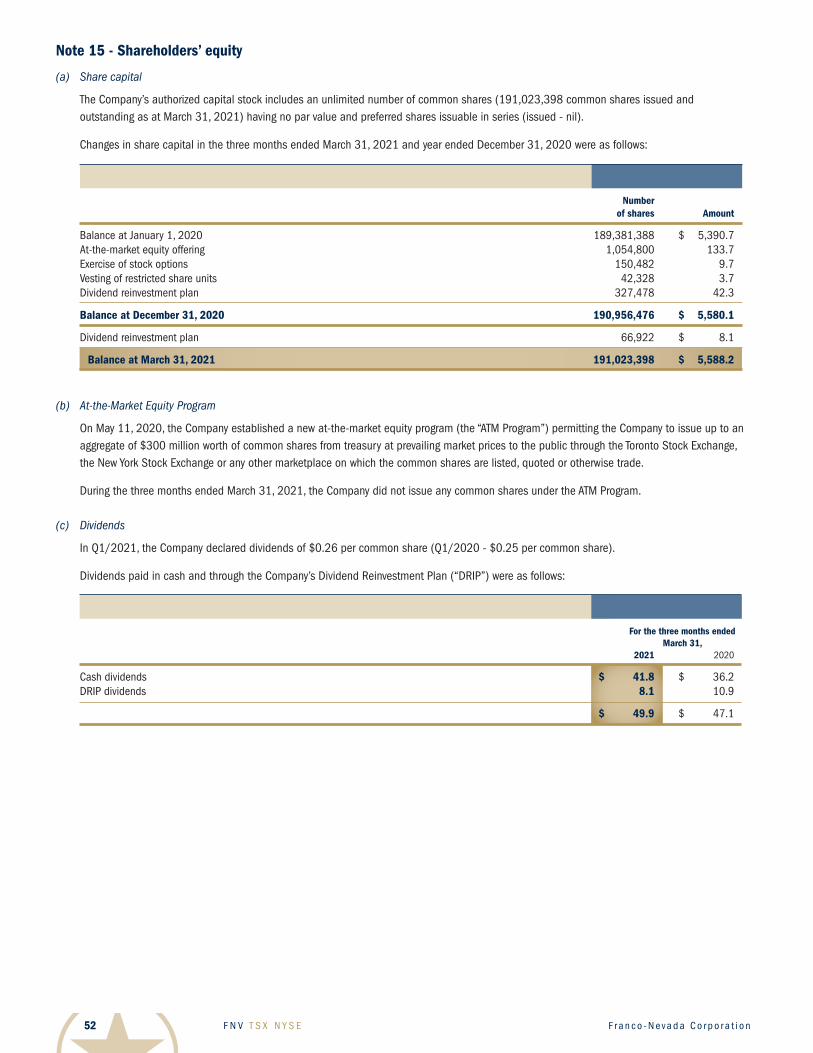
F N V T S X N Y S E F r a n c o - N eva d a C o r p o r a t i o n52
Note 15 - Shareholders’ equity
(a) Share capital
The Company’s authorized capital stock includes an unlimited number of common shares (191,023,398 common shares issued and outstanding as at March 31, 2021) having no par value and preferred shares issuable in series (issued - nil).
Changes in share capital in the three months ended March 31, 2021 and year ended December 31, 2020 were as follows:
Number of shares Amount
Balance at January 1, 2020 189,381,388 $ 5,390.7At-the-market equity offering 1,054,800 133.7Exercise of stock options 150,482 9.7Vesting of restricted share units 42,328 3.7Dividend reinvestment plan 327,478 42.3
BalanceatDecember31,2020 190,956,476 $ 5,580.1
Dividend reinvestment plan 66,922 $ 8.1
BalanceatMarch31,2021 191,023,398 $ 5,588.2
(b) At-the-Market Equity Program
On May 11, 2020, the Company established a new at-the-market equity program (the “ATM Program”) permitting the Company to issue up to an aggregate of $300 million worth of common shares from treasury at prevailing market prices to the public through the Toronto Stock Exchange, the New York Stock Exchange or any other marketplace on which the common shares are listed, quoted or otherwise trade. During the three months ended March 31, 2021, the Company did not issue any common shares under the ATM Program.
(c) Dividends
In Q1/2021, the Company declared dividends of $0.26 per common share (Q1/2020 - $0.25 per common share). Dividends paid in cash and through the Company’s Dividend Reinvestment Plan (“DRIP”) were as follows:
For the three months ended March 31, 2021 2020
Cash dividends $ 41.8 $ 36.2DRIP dividends 8.1 10.9
$ 49.9 $ 47.1
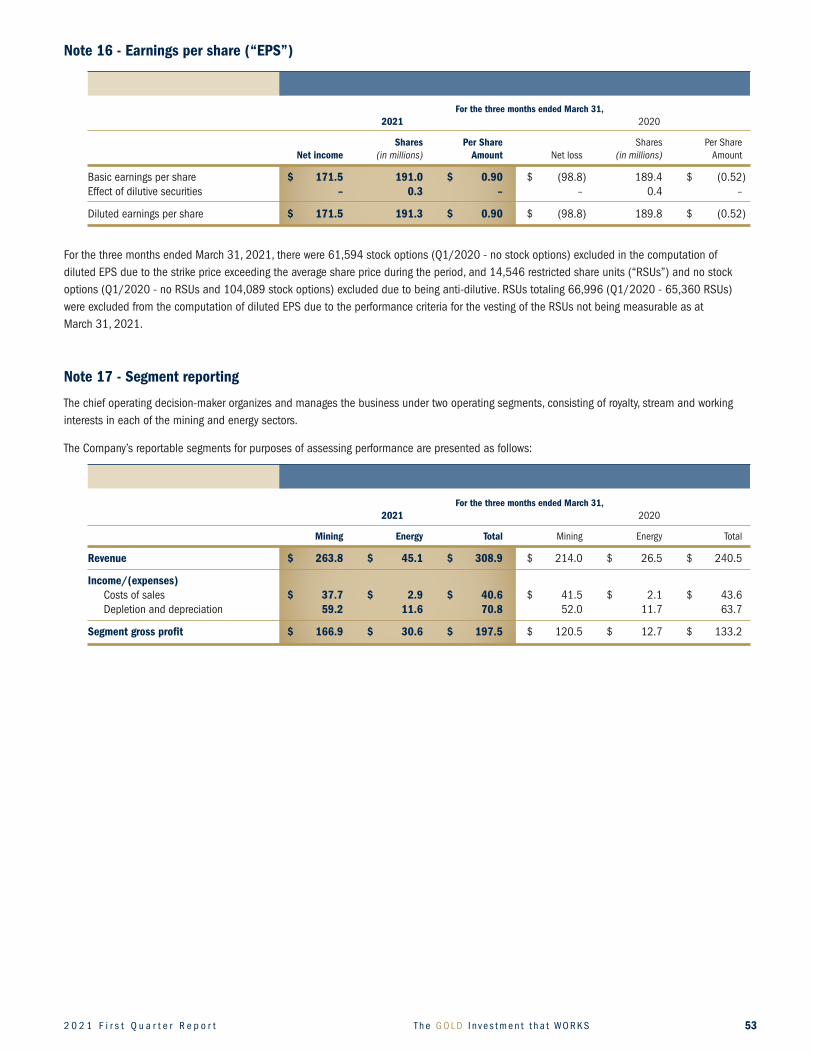
2 0 2 1 F i r s t Q u a r t e r R e p o r t T h e G O L D I nve s t m e n t t h a t WO R K S 53
Note16-Earningspershare(“EPS”)
For the three months ended March 31, 2021 2020
Shares Per Share Shares Per Share Net income (in millions) Amount Net loss (in millions) Amount
Basic earnings per share $ 171.5 191.0 $ 0.90 $ (98.8 ) 189.4 $ (0.52 )Effect of dilutive securities – 0.3 – – 0.4 –
Diluted earnings per share $ 171.5 191.3 $ 0.90 $ (98.8 ) 189.8 $ (0.52 )
For the three months ended March 31, 2021, there were 61,594 stock options (Q1/2020 - no stock options) excluded in the computation of diluted EPS due to the strike price exceeding the average share price during the period, and 14,546 restricted share units (“RSUs”) and no stock options (Q1/2020 - no RSUs and 104,089 stock options) excluded due to being anti-dilutive. RSUs totaling 66,996 (Q1/2020 - 65,360 RSUs) were excluded from the computation of diluted EPS due to the performance criteria for the vesting of the RSUs not being measurable as at March 31, 2021.
Note 17 - Segment reporting
The chief operating decision-maker organizes and manages the business under two operating segments, consisting of royalty, stream and working interests in each of the mining and energy sectors.
The Company’s reportable segments for purposes of assessing performance are presented as follows:
For the three months ended March 31, 2021 2020
Mining Energy Total Mining Energy Total
Revenue $ 263.8 $ 45.1 $ 308.9 $ 214.0 $ 26.5 $ 240.5
Income/(expenses) Costs of sales $ 37.7 $ 2.9 $ 40.6 $ 41.5 $ 2.1 $ 43.6 Depletion and depreciation 59.2 11.6 70.8 52.0 11.7 63.7
Segment gross profit $ 166.9 $ 30.6 $ 197.5 $ 120.5 $ 12.7 $ 133.2
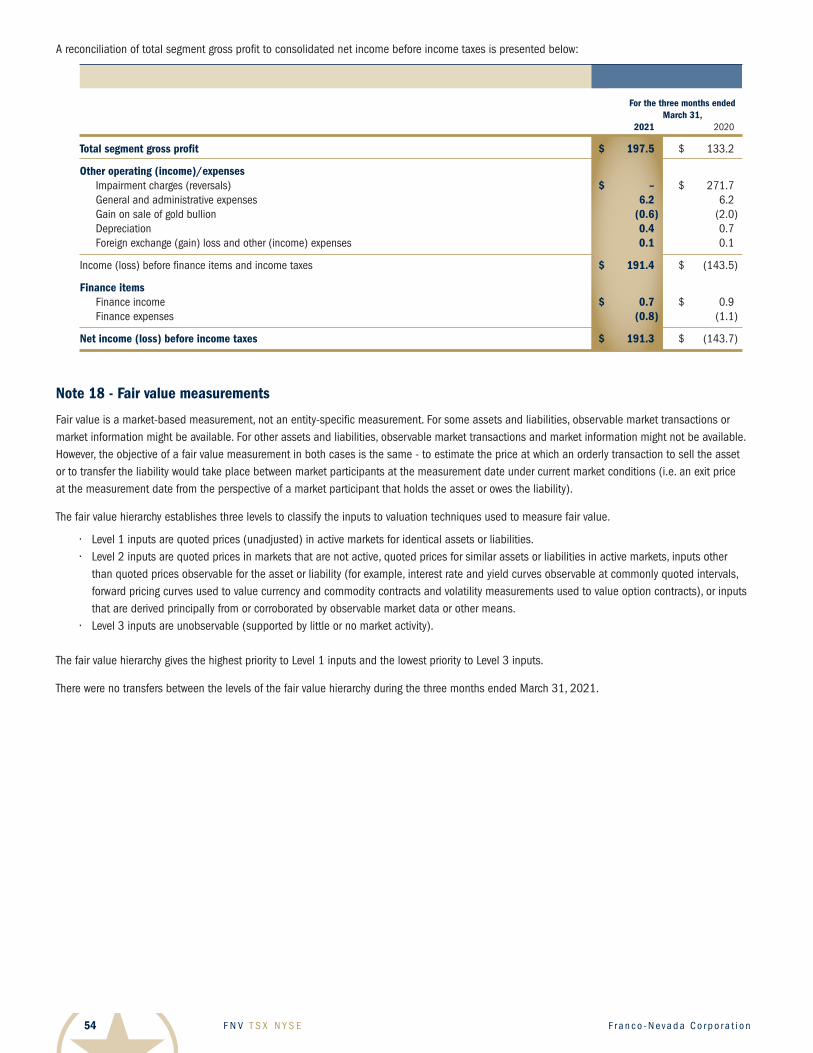
F N V T S X N Y S E F r a n c o - N eva d a C o r p o r a t i o n54
A reconciliation of total segment gross profit to consolidated net income before income taxes is presented below:
For the three months ended March 31, 2021 2020
Totalsegmentgrossprofit $ 197.5 $ 133.2
Otheroperating(income)/expenses Impairment charges (reversals) $ – $ 271.7 General and administrative expenses 6.2 6.2 Gain on sale of gold bullion (0.6) (2.0 ) Depreciation 0.4 0.7 Foreign exchange (gain) loss and other (income) expenses 0.1 0.1
Income (loss) before finance items and income taxes $ 191.4 $ (143.5 )
Finance items Finance income $ 0.7 $ 0.9 Finance expenses (0.8) (1.1 )
Netincome(loss)beforeincometaxes $ 191.3 $ (143.7 )
Note 18 - Fair value measurements
Fair value is a market-based measurement, not an entity-specific measurement. For some assets and liabilities, observable market transactions or market information might be available. For other assets and liabilities, observable market transactions and market information might not be available. However, the objective of a fair value measurement in both cases is the same - to estimate the price at which an orderly transaction to sell the asset or to transfer the liability would take place between market participants at the measurement date under current market conditions (i.e. an exit price at the measurement date from the perspective of a market participant that holds the asset or owes the liability).
The fair value hierarchy establishes three levels to classify the inputs to valuation techniques used to measure fair value.
• Level1inputsarequotedprices(unadjusted)inactivemarketsforidenticalassetsorliabilities. • Level2inputsarequotedpricesinmarketsthatarenotactive,quotedpricesforsimilarassetsorliabilitiesinactivemarkets,inputsother
than quoted prices observable for the asset or liability (for example, interest rate and yield curves observable at commonly quoted intervals, forward pricing curves used to value currency and commodity contracts and volatility measurements used to value option contracts), or inputs that are derived principally from or corroborated by observable market data or other means.
• Level3inputsareunobservable(supportedbylittleornomarketactivity).
The fair value hierarchy gives the highest priority to Level 1 inputs and the lowest priority to Level 3 inputs.
There were no transfers between the levels of the fair value hierarchy during the three months ended March 31, 2021.
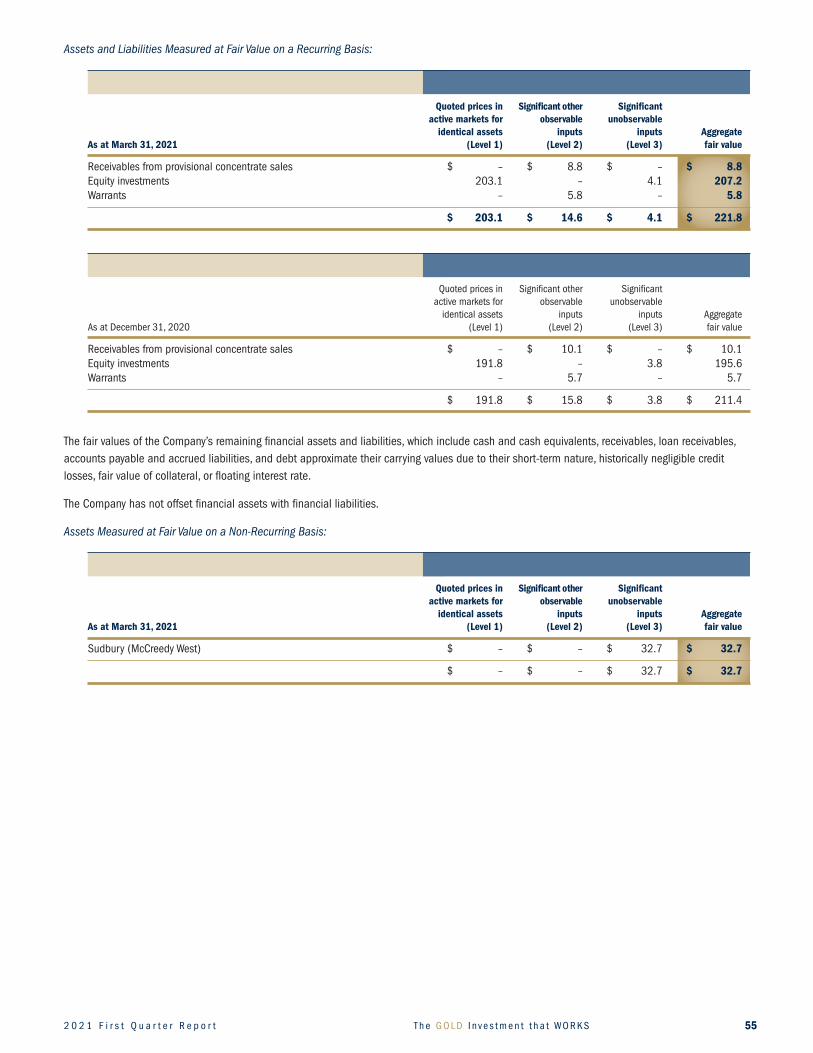
2 0 2 1 F i r s t Q u a r t e r R e p o r t T h e G O L D I nve s t m e n t t h a t WO R K S 55
Assets and Liabilities Measured at Fair Value on a Recurring Basis:
Quoted prices in Significant other Significant active markets for observable unobservable identical assets inputs inputs Aggregate As at March 31, 2021 (Level1) (Level2) (Level3) fair value
Receivables from provisional concentrate sales $ – $ 8.8 $ – $ 8.8Equity investments 203.1 – 4.1 207.2Warrants – 5.8 – 5.8
$ 203.1 $ 14.6 $ 4.1 $ 221.8
Quoted prices in Significant other Significant active markets for observable unobservable identical assets inputs inputs Aggregate As at December 31, 2020 (Level 1) (Level 2) (Level 3) fair value
Receivables from provisional concentrate sales $ – $ 10.1 $ – $ 10.1Equity investments 191.8 – 3.8 195.6Warrants – 5.7 – 5.7
$ 191.8 $ 15.8 $ 3.8 $ 211.4
The fair values of the Company’s remaining financial assets and liabilities, which include cash and cash equivalents, receivables, loan receivables, accounts payable and accrued liabilities, and debt approximate their carrying values due to their short-term nature, historically negligible credit losses, fair value of collateral, or floating interest rate.
The Company has not offset financial assets with financial liabilities.
Assets Measured at Fair Value on a Non-Recurring Basis:
Quoted prices in Significant other Significant active markets for observable unobservable identical assets inputs inputs Aggregate As at March 31, 2021 (Level1) (Level2) (Level3) fair value
Sudbury (McCreedy West) $ – $ – $ 32.7 $ 32.7
$ – $ – $ 32.7 $ 32.7
F N V T S X N Y S E F r a n c o - N eva d a C o r p o r a t i o n56
The valuation techniques that are used to measure fair value are as follows:
(a) Receivables
The fair values of receivables arising from gold and platinum group metal concentrate sales contracts that contain provisional pricing mechanisms are determined using the appropriate quoted forward prices from the exchange that is the principal active market for the particular metal. As such, these receivables are classified within Level 2 of the fair value hierarchy.
(b) Investments
The fair values of publicly-traded investments are determined based on a market approach reflecting the closing prices of each particular security at the statement of financial position date. The closing prices are quoted market prices obtained from the exchange that is the principal active market for the particular security, and therefore are classified within Level 1 of the fair value hierarchy.
The Company holds one equity investment that does not have a quoted market price in an active market. The Company has assessed the fair value of the instrument based on a valuation technique using unobservable discounted future cash flows. As a result, the fair value is classified within Level 3 of the fair value hierarchy.
The fair values of warrants are estimated using the Black-Scholes pricing model which requires the use of inputs that are observable in the market. As such, these investments are classified within Level 2 of the fair value hierarchy.
(c) Royalty, stream, and working interests
The fair values of royalty, stream, and working interests are determined primarily using an income approach using unobservable discounted future cash-flows. As a result, the fair values are classified within Level 3 of the fair value hierarchy.
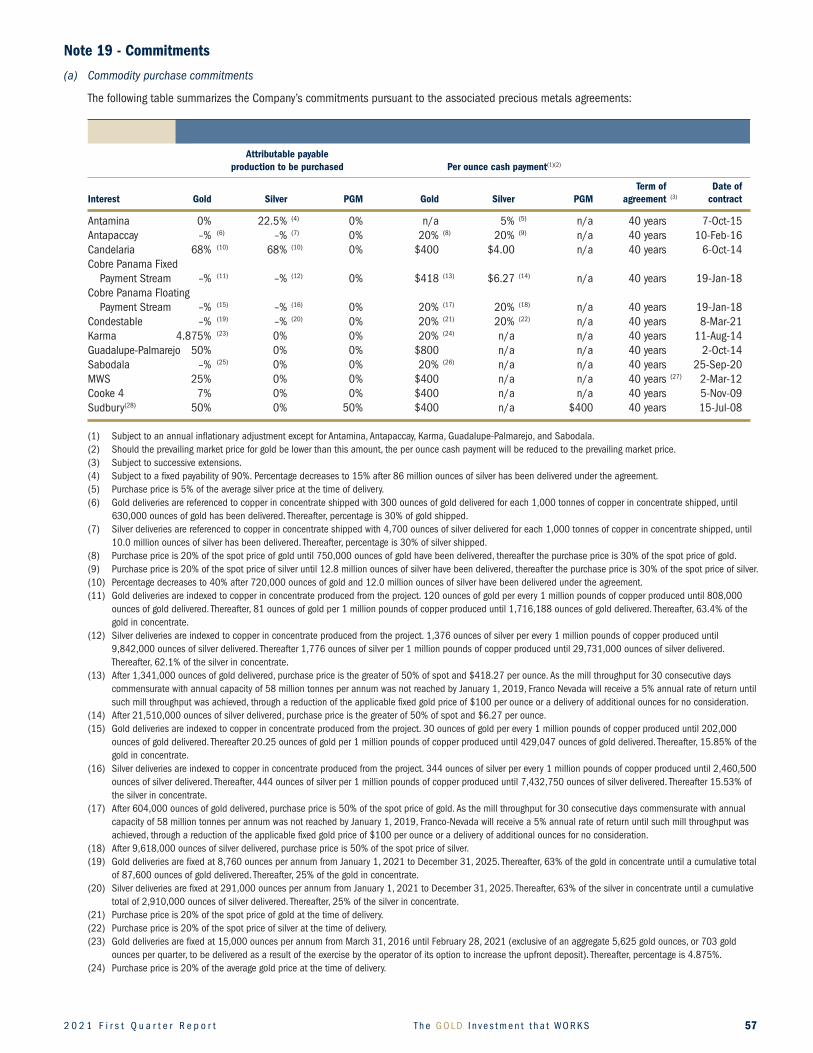
2 0 2 1 F i r s t Q u a r t e r R e p o r t T h e G O L D I nve s t m e n t t h a t WO R K S 57
Note 19 - Commitments
(a) Commodity purchase commitments
The following table summarizes the Company’s commitments pursuant to the associated precious metals agreements:
Attributable payable production to be purchased Per ounce cash payment(1)(2)
Termof Dateof
Interest Gold Silver PGM Gold Silver PGM agreement (3) contract
Antamina 0% 22.5% (4) 0% n/a 5% (5) n/a 40 years 7-Oct-15Antapaccay –% (6) –% (7) 0% 20% (8) 20% (9) n/a 40 years 10-Feb-16Candelaria 68% (10) 68% (10) 0% $400 $4.00 n/a 40 years 6-Oct-14Cobre Panama Fixed Payment Stream –% (11) –% (12) 0% $418 (13) $6.27 (14) n/a 40 years 19-Jan-18Cobre Panama Floating Payment Stream –% (15) –% (16) 0% 20% (17) 20% (18) n/a 40 years 19-Jan-18Condestable –% (19) –% (20) 0% 20% (21) 20% (22) n/a 40 years 8-Mar-21Karma 4.875% (23) 0% 0% 20% (24) n/a n/a 40 years 11-Aug-14Guadalupe-Palmarejo 50% 0% 0% $800 n/a n/a 40 years 2-Oct-14Sabodala –% (25) 0% 0% 20% (26) n/a n/a 40 years 25-Sep-20MWS 25% 0% 0% $400 n/a n/a 40 years (27) 2-Mar-12Cooke 4 7% 0% 0% $400 n/a n/a 40 years 5-Nov-09Sudbury(28) 50% 0% 50% $400 n/a $400 40 years 15-Jul-08
(1) Subject to an annual inflationary adjustment except for Antamina, Antapaccay, Karma, Guadalupe-Palmarejo, and Sabodala.(2) Should the prevailing market price for gold be lower than this amount, the per ounce cash payment will be reduced to the prevailing market price.(3) Subject to successive extensions.(4) Subject to a fixed payability of 90%. Percentage decreases to 15% after 86 million ounces of silver has been delivered under the agreement.(5) Purchase price is 5% of the average silver price at the time of delivery.(6) Gold deliveries are referenced to copper in concentrate shipped with 300 ounces of gold delivered for each 1,000 tonnes of copper in concentrate shipped, until
630,000 ounces of gold has been delivered. Thereafter, percentage is 30% of gold shipped.(7) Silver deliveries are referenced to copper in concentrate shipped with 4,700 ounces of silver delivered for each 1,000 tonnes of copper in concentrate shipped, until
10.0 million ounces of silver has been delivered. Thereafter, percentage is 30% of silver shipped.(8) Purchase price is 20% of the spot price of gold until 750,000 ounces of gold have been delivered, thereafter the purchase price is 30% of the spot price of gold.(9) Purchase price is 20% of the spot price of silver until 12.8 million ounces of silver have been delivered, thereafter the purchase price is 30% of the spot price of silver.(10) Percentage decreases to 40% after 720,000 ounces of gold and 12.0 million ounces of silver have been delivered under the agreement. (11) Gold deliveries are indexed to copper in concentrate produced from the project. 120 ounces of gold per every 1 million pounds of copper produced until 808,000
ounces of gold delivered. Thereafter, 81 ounces of gold per 1 million pounds of copper produced until 1,716,188 ounces of gold delivered. Thereafter, 63.4% of the gold in concentrate.
(12) Silver deliveries are indexed to copper in concentrate produced from the project. 1,376 ounces of silver per every 1 million pounds of copper produced until 9,842,000 ounces of silver delivered. Thereafter 1,776 ounces of silver per 1 million pounds of copper produced until 29,731,000 ounces of silver delivered. Thereafter, 62.1% of the silver in concentrate.
(13) After 1,341,000 ounces of gold delivered, purchase price is the greater of 50% of spot and $418.27 per ounce. As the mill throughput for 30 consecutive days commensurate with annual capacity of 58 million tonnes per annum was not reached by January 1, 2019, Franco Nevada will receive a 5% annual rate of return until such mill throughput was achieved, through a reduction of the applicable fixed gold price of $100 per ounce or a delivery of additional ounces for no consideration.
(14) After 21,510,000 ounces of silver delivered, purchase price is the greater of 50% of spot and $6.27 per ounce. (15) Gold deliveries are indexed to copper in concentrate produced from the project. 30 ounces of gold per every 1 million pounds of copper produced until 202,000
ounces of gold delivered. Thereafter 20.25 ounces of gold per 1 million pounds of copper produced until 429,047 ounces of gold delivered. Thereafter, 15.85% of the gold in concentrate.
(16) Silver deliveries are indexed to copper in concentrate produced from the project. 344 ounces of silver per every 1 million pounds of copper produced until 2,460,500 ounces of silver delivered. Thereafter, 444 ounces of silver per 1 million pounds of copper produced until 7,432,750 ounces of silver delivered. Thereafter 15.53% of the silver in concentrate.
(17) After 604,000 ounces of gold delivered, purchase price is 50% of the spot price of gold. As the mill throughput for 30 consecutive days commensurate with annual capacity of 58 million tonnes per annum was not reached by January 1, 2019, Franco-Nevada will receive a 5% annual rate of return until such mill throughput was achieved, through a reduction of the applicable fixed gold price of $100 per ounce or a delivery of additional ounces for no consideration.
(18) After 9,618,000 ounces of silver delivered, purchase price is 50% of the spot price of silver. (19) Gold deliveries are fixed at 8,760 ounces per annum from January 1, 2021 to December 31, 2025. Thereafter, 63% of the gold in concentrate until a cumulative total
of 87,600 ounces of gold delivered. Thereafter, 25% of the gold in concentrate.(20) Silver deliveries are fixed at 291,000 ounces per annum from January 1, 2021 to December 31, 2025. Thereafter, 63% of the silver in concentrate until a cumulative
total of 2,910,000 ounces of silver delivered. Thereafter, 25% of the silver in concentrate.(21) Purchase price is 20% of the spot price of gold at the time of delivery. (22) Purchase price is 20% of the spot price of silver at the time of delivery. (23) Gold deliveries are fixed at 15,000 ounces per annum from March 31, 2016 until February 28, 2021 (exclusive of an aggregate 5,625 gold ounces, or 703 gold
ounces per quarter, to be delivered as a result of the exercise by the operator of its option to increase the upfront deposit). Thereafter, percentage is 4.875%.(24) Purchase price is 20% of the average gold price at the time of delivery.
F N V T S X N Y S E F r a n c o - N eva d a C o r p o r a t i o n58
(25) Based on amended agreement with an effective date of September 1, 2020, gold deliveries are fixed at 783.33 ounces per month until 105,750 ounces of gold is delivered. Thereafter, percentage is 6% of gold production (subject to reconciliation after fixed delivery period to determine if Franco-Nevada would have received more or less than 105,750 ounces of gold under the original 6% variable stream for such period, entitling the operator to a credit for an over-delivery applied against future stream deliveries or a one-time additional delivery to Franco-Nevada for an under-delivery).
(26) Purchase price is 20% of prevailing market price at the time of delivery.(27) Agreement is capped at 312,500 ounces of gold.(28) The Company is committed to purchase 50% of the precious metals contained in ore from the properties. Payment is based on gold equivalent ounces. For McCreedy
West, the fixed price per gold equivalent ounce was increased to $800 per ounce (with no annual inflationary adjustment), effective July 1, 2018 until December 31, 2021
(b) Capital commitments
The Company is committed to funding its share of the acquisition of mineral rights acquired through the Royalty Acquisition Venture with Continental, as described in note 3(c).
In connection with the acquisition of the 1% NSR on SolGold plc’s (“SolGold”) Alpala project for $100.0 million, the Company is committed to funding a potential upsizing of the NSR to 1.5% for an additional $50.0 million until May 11, 2021. The upsizing option is at the discretion of SolGold.
Note 20 - Contingencies
Canada Revenue Agency Audit:
The CRA is conducting an audit of Franco-Nevada for the 2012-2017 taxation years. The following table provides a summary of the various CRA audit and reassessment matters further detailed below:
TaxationYears PotentialExposureforTax,InterestandPenalties CRA Position Reassessed (in millions)
Canadian Domestic Upfront payment made in connection with precious metal 2014, 2015 For 2014-2015:Tax Matters stream agreements should be deducted for income tax For 2014-2015: purposes in a similar manner to how such amount is Interest and other penalties: $0.2 (C$0.2) expensed for financial statement purposes. If CRA were to reassess the 2016-2020 taxation years on the same basis: Tax: $34.1 (C$42.8) Interest and other penalties: $4.6 (C$5.8)
Transfer Pricing Transfer pricing provisions in the Act (as defined below) 2013, 2014, For 2013-2015:(Mexico) apply such that a majority of the income earned by the 2015 Tax: $20.1 (C$25.3) Company’s Mexican subsidiary should be included in Transfer pricing penalties: $8.2 (C$10.3) the income of the Company and subject to tax in Canada. Interest and other penalties: $7.7 (C$9.7)
If CRA were to reassess the 2016-2020 taxation years on the same basis: Tax: $3.7 (C$4.6) Transfer pricing penalties: $1.4 (C$1.7) Interest and other penalties: $0.9 (C$1.1)

2 0 2 1 F i r s t Q u a r t e r R e p o r t T h e G O L D I nve s t m e n t t h a t WO R K S 59
TaxationYears PotentialExposureforTax,InterestandPenalties CRA Position Reassessed (in millions)
Transfer Pricing Transfer pricing provisions in the Act (as defined below) 2014, 2015 For 2014-2015:(Barbados) apply such that a majority of the income relating to Tax: $5.3 (C$6.7) certain precious metal streams earned by the Company’s Transfer pricing penalties: $2.0 (C$2.5) Barbadian subsidiary should be included in the income Interest and other penalties: $1.9 (C$2.4) of the Company and subject to tax in Canada. If CRA were to reassess the 2016-2020 taxation years on the same basis: Tax: $138.5 (C$174.2) Transfer pricing penalties: $52.1 (C$65.6) Interest and other penalties: $12.6 (C$15.7)
FAPI (Barbados) The FAPI provisions in the Act (as defined below) apply 2012, 2013 For 2012-2013: such that a majority of the income relating to precious metal Tax: $6.1 (C$7.7) streams earned by the Company’s Barbadian subsidiary, Interest and other penalties: $2.6 (C$3.3) in 2012 and 2013, should be included in the income of the Company and subject to tax in Canada. Based on CRA’s proposal letter, no reassessments for this issue for years after 2013 are expected.
(a) Canadian Domestic Tax Matters (2014-2015):
In October 2019, certain wholly-owned Canadian subsidiaries of the Company received Notices of Reassessment for the 2014 and 2015 taxation years (the “Domestic Reassessments”) in which the CRA increased income by adjusting the timing of the deduction of the upfront payments which were made in connection with precious metal stream agreements. The CRA’s position is that the upfront payment should be deducted for income tax purposes in a similar manner to how such upfront payment is expensed for financial statement purposes. Consequently, the CRA’s position results in a slower deduction of the upfront payment and an acceleration of the payment of Canadian taxes. This results in the Company being subject to an incremental payment of Federal and provincial income taxes for these years of $1.1 million (C$1.4 million) (after applying available non-capital losses and other deductions) plus estimated interest (calculated to March 31, 2021) and other penalties of $0.2 million (C$0.2 million). The Company has filed formal Notices of Objection with the CRA against the Domestic Reassessments and has posted security in cash for 50% of the reassessed amounts of tax, interest and penalties. The Company intends to commence an appeal in the Tax Court of Canada with respect to these reassessments.
If the CRA were to reassess the particular Canadian subsidiaries for taxation years 2016 through 2020 on the same basis, the Company estimates that it would be subject to an incremental payment of Canadian tax for these years of approximately $34.1 million (C$42.8 million) (after applying available non-capital losses and other deductions) plus interest (calculated to March 31, 2021) and other penalties of approximately $4.6 million (C$5.8 million). Similarly, an additional amount of tax, interest and applicable penalties would arise for the 2021 taxation year.
F N V T S X N Y S E F r a n c o - N eva d a C o r p o r a t i o n60
(b) Mexico (2013-2015):
In December 2018, the Company received a Notice of Reassessment from the CRA for the 2013 taxation year (the “2013 Reassessment”) in relation to its Mexican subsidiary. The reassessment was made on the basis of the transfer pricing provisions in the Income Tax Act (Canada) (the “Act”) and asserts that a majority of the income earned by the Mexican subsidiary should have been included in the income of the Company and subject to tax in Canada. The 2013 Reassessment results in additional Federal and provincial income taxes of $8.6 million (C$10.8 million) plus estimated interest (calculated to March 31, 2021) and other penalties of $3.5 million (C$4.4 million) but before any relief under the Canada-Mexico tax treaty.
In December 2019, the Company received Notices of Reassessment for the 2014 and 2015 taxation years (the “2014 and 2015 Reassessments”) on the same basis as the 2013 Reassessment, resulting in additional Federal and provincial income taxes of $11.5 million (C$14.5 million) plus estimated interest (calculated to March 31, 2021) and other penalties of $4.2 million (C$5.3 million) but before any relief under the Canada-Mexico tax treaty.
The Company has filed formal Notices of Objection with the CRA against the 2013 Reassessment and the 2014 and 2015 Reassessments and has posted security in the form of a standby letter of credit for 50% of the reassessed amounts of tax, interest and penalties, as referenced in Note 9 (a). Further, the Company has commenced an appeal in the Tax Court of Canada with respect to these reassessments.
For taxation years 2013 through 2015, the Company’s Mexican subsidiary paid a total of $30.3 million (419.4 million Pesos) in cash taxes, at a 30% tax rate, to the Mexican tax authorities on income earned in Mexico. If required, the Company intends to seek relief from double taxation under the Canada-Mexico tax treaty.
In December 2020, the CRA issued revised 2013 Reassessment and 2014 and 2015 Reassessments to include transfer pricing penalties of $8.2 million (C$10.3 million). The Company has filed formal Notices of Objection with the CRA against these revised reassessments and has posted security in the form of cash for 50% of the reassessed amounts of penalties. The Company intends to commence an appeal in the Tax Court of Canada with respect to these revised reassessments.
If the CRA were to reassess the Company for taxation years 2016 through 2020 on the same basis and continue to apply transfer pricing penalties, the Company estimates that it would be subject to additional Canadian tax for these years of approximately $3.7 million (C$4.6 million), transfer pricing penalties of approximately $1.4 million (C$1.7 million) plus interest (calculated to March 31, 2021) and other penalties of approximately $0.9 million (C$1.1 million) but before any relief under the Canada-Mexico tax treaty. The Company’s Mexican subsidiary paid $3.8 million (71.0 million Pesos) in cash taxes, at a 30% tax rate, to the Mexican tax authorities on income earned in Mexico for the 2016 year and ceased operations after 2016.
(c) Barbados (2014-2015):
The 2014 and 2015 Reassessments also reassess the Company in relation to its Barbadian subsidiary. The reassessments were made on the basis of the transfer pricing provisions in the Act and assert that a majority of the income relating to certain precious metal streams earned by the Barbadian subsidiary should have been included in the income of the Company and subject to tax in Canada, resulting in additional Federal and provincial income taxes of $5.3 million (C$6.7 million) plus estimated interest (calculated to March 31, 2021) and other penalties of $1.9 million (C$2.4 million). As noted previously, the Company has filed formal Notices of Objection with the CRA against the 2014 and 2015 Reassessments and has posted security in the form of a standby letter of credit for 50% of the reassessed amounts of tax, interest and penalties, as referenced in Note 9 (a). Further, the Company has commenced an appeal in the Tax Court of Canada with respect to the 2014 and 2015 Reassessments.
As noted above, in December 2020, the CRA issued revised 2014 and 2015 Reassessments to include transfer pricing penalties of $2.0 million (C$2.5 million). The Company has filed formal Notices of Objection with the CRA against these revised reassessments and has posted security in the form of cash for 50% of the reassessed amounts of penalties. The Company intends to commence an appeal in the Tax Court of Canada with respect to these revised reassessments.
If the CRA were to reassess the Company for taxation years 2016 through 2020 on the same basis and continue to apply transfer pricing penalties, the Company estimates that it would be subject to additional Canadian tax for these years of approximately $138.5 million (C$174.2 million), transfer pricing penalties of approximately $52.1 million (C$65.6 million) plus interest (calculated to March 31, 2021) and other penalties of approximately $12.6 million (C$15.7 million). Similarly, an additional amount of tax, interest and applicable penalties would arise for the 2021 taxation year.
2 0 2 1 F i r s t Q u a r t e r R e p o r t T h e G O L D I nve s t m e n t t h a t WO R K S 61
(d) Barbados (2012-2013):
In August 2020, the Company received Notices of Reassessment for the 2012 and 2013 taxation years (the “FAPI Reassessments” and, collectively with the Domestic Reassessments, the 2013 Reassessment and the 2014 and 2015 Reassessments, the “Reassessments”) in relation to its Barbadian subsidiary. The reassessments assert that a majority of the income relating to precious metal streams earned by the Barbadian subsidiary, in those years, should have been included in the income of its Canadian parent company and subject to tax in Canada as Foreign Accrual Property Income (“FAPI”). The CRA has noted that its position may not extend beyond the 2013 taxation year. The FAPI Reassessments result in additional Federal and provincial income taxes of $6.1 million (C$7.7 million) plus estimated interest (calculated to March 31, 2021) and other penalties of $2.6 million (C$3.3 million). The Company has filed formal Notices of Objection with the CRA against the FAPI Reassessments and has posted security in cash for 50% of the reassessed amounts of tax, interest and penalties.
The CRA recently expanded its audit to include the 2016 and 2017 taxation years and the Company has not received any proposal or notices of reassessment for these taxation years.
Management believes that the Company and its subsidiaries have filed all tax returns and paid all applicable taxes in compliance with Canadian and applicable foreign tax laws and, as a result, no amounts have been recorded in the financial statements of the Company for the Reassessments, or for any potential tax exposure that may arise in respect of these matters. The Company does not believe that the Reassessments are supported by Canadian tax law and jurisprudence and intends to vigorously defend its tax filing positions.
The CRA audit is ongoing and there can be no assurance that the CRA will not further challenge the manner in which the Company or any of its subsidiaries has filed its tax returns and reported its income. In the event that the CRA successfully challenges the manner in which the Company or a subsidiary has filed its tax returns and reported its income, this could potentially result in additional income taxes, penalties and interest, which could have a material adverse effect on the Company.
Note 21 - Subsequent events
(a) Acquisition of Vale Royalty Debentures - Brazil
On April 16, 2021, the Company acquired 57 million of Vale S.A.’s (“Vale”) outstanding participating debentures (“Royalty Debentures”) for $538 million. The Royalty Debenture terms, on a 100% basis, provide for a 1.8% (0.264% attributable) net sales royalty on (i) iron ore sales from Vale’s Northern System, including the Serra Norte, Serra Sul and Serra Leste operations, and (ii) an estimated 70% of iron ore sales from Vale’s Southeastern System, in the medium term, including from the Itabira, Minas Centrais (Brucutu) and Mariana (Fazendão) mining complexes. The Southeastern System will start contributions under the Royalty Debentures once a cumulative sales threshold of 1.7 Bt of iron ore has been reached. The Royalty Debentures also provide for a 2.5% (0.367% attributable) net sales royalty on certain copper and gold assets. The Royalty Debentures apply on a 50% basis (i.e. 1.25% of net sales, 0.183% attributable) to the Sossego mine. Additionally, the Royalty Debentures provide for a 1% (0.147% attributable) net sales royalty on all other minerals (covered mining rights include prospective deposits for other minerals including zinc and manganese, amongst others), subject to certain thresholds. 1% (0.147% attributable) also applies to proceeds in the event of an underlying asset sale.
Royalty payments are made on a semi-annual basis on March 31st and September 30th of each year reflecting sales in the preceding half calendar year period. The first payment for H1/2021 will be payable to the Company on September 30, 2021, reflecting a net sales royalty for the period January 1, 2021 to June 30, 2021.
Management has determined that the Royalty Debentures are economically equivalent to royalty interests with no maturity until the underlying mining rights are extinguished, and will be accounting for them as an acquisition of a mineral interest.
(b) Corporate Revolver draw
On April 12, 2021, the Company drew down $150.0 million from its Corporate Revolver to finance part of the acquisition of the Vale Royalty Debentures, referenced in note 21(a).
F N V T S X N Y S E F r a n c o - N eva d a C o r p o r a t i o n62
Corporate Information
Executive Management
PaulBrink President & CEO
Sandip RanaChief Financial Officer
Lloyd Hong Chief Legal Officer
Eaun Gray Senior Vice President, Business Development
JasonO’ConnellSenior Vice President, Energy
Directors
David HarquailChair
PaulBrinkPresident & CEO
TomAlbanese
Derek Evans
Dr. Catharine Farrow
Louis Gignac
MaureenJensen
JenniferMaki
Randall Oliphant
Hon. David R. Peterson1
Elliott Pew
Chair EmeritusPierre Lassonde
Honourary DirectorGraham Farquharson
Head Office
199 Bay Street, Suite 2000P.O. Box 285Commerce Court Postal StationToronto, Canada M5L 1G9Tel: (416) 306-6300
BarbadosOffice
Ground Floor, Balmoral Hall, Balmoral Gap,Hastings, Christ ChurchBarbados, BB14034Tel: (246) 434-8200
U.S. Office
1745 Shea Center Drive, Suite 400 Highlands RanchColorado, USA 80129 Tel: (720) 344-4986
Australia Office
44 Kings Park Road, Suite 41West Perth, WA 6005, AustraliaTel: 61-8-6263-4425
Listings of Common Shares
Toronto Stock Exchange: FNV New York Stock Exchange: FNV
Share Capital
As at May 5, 2021
Common shares outstanding 191,023,398Reserved for: Options & other 848,670
Fully diluted: 191,872,068
Auditors
PricewaterhouseCoopers LLP Toronto, Canada
TransferAgent
Computershare Investor Services Inc.100 University Avenue, 8th FloorToronto, Canada M5J 2Y1Toll Free: (800) 564-6253 Tel: (514) [email protected]
Investor Information
Candida HaydenCorporate Affairs
[email protected] www.franco-nevada.comTel: (416) 306-6323 Toll Free: (877) 401-3833
1 Mr. Peterson is not standing for re-election at the 2021 Annual and Special Meeting of Shareholders

FNV TSX/NYSE
www.franco-nevada.com


