24
A METRICS System for Design Process Optimization Andrew B. Kahng and Stefanus Mantik* UCSD CSE and ECE Depts., La Jolla, CA *UCLA CS Dept., Los Angeles, CA
| Date post: | 21-Dec-2015 |
| Category: |
Documents |
| View: | 220 times |
| Download: | 3 times |
A METRICS System for Design Process OptimizationA METRICS System for Design Process Optimization
Andrew B. Kahng and Stefanus Mantik*
UCSD CSE and ECE Depts., La Jolla, CA
*UCLA CS Dept., Los Angeles, CA
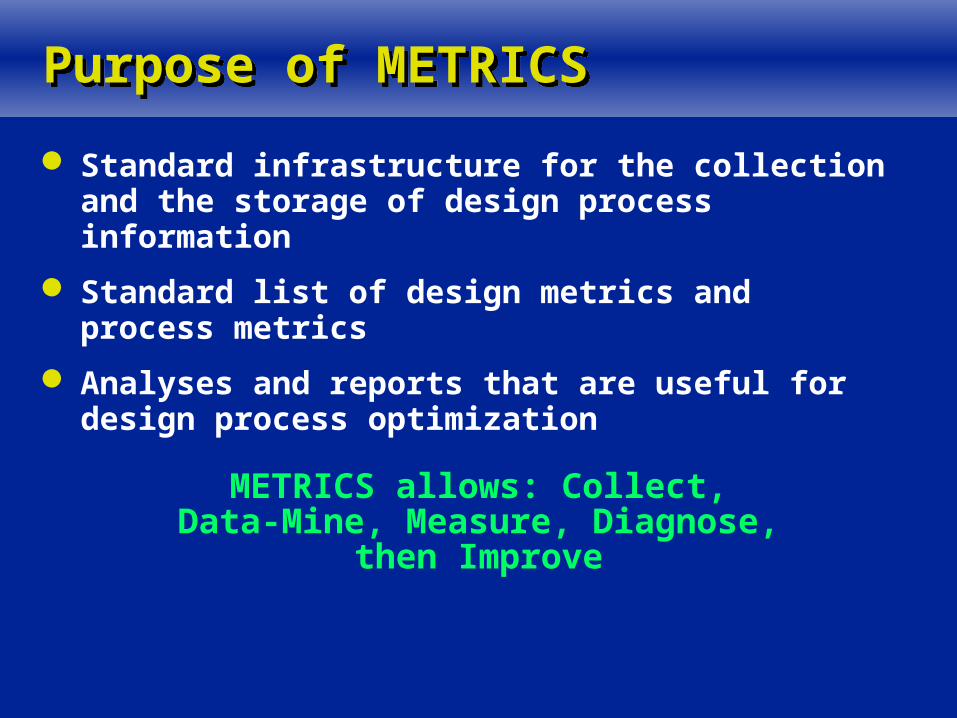
Purpose of METRICSPurpose of METRICS
Standard infrastructure for the collection and the storage of design process information
Standard list of design metrics and process metrics
Analyses and reports that are useful for design process optimization
METRICS allows: Collect, Data-Mine, Measure, Diagnose, then Improve
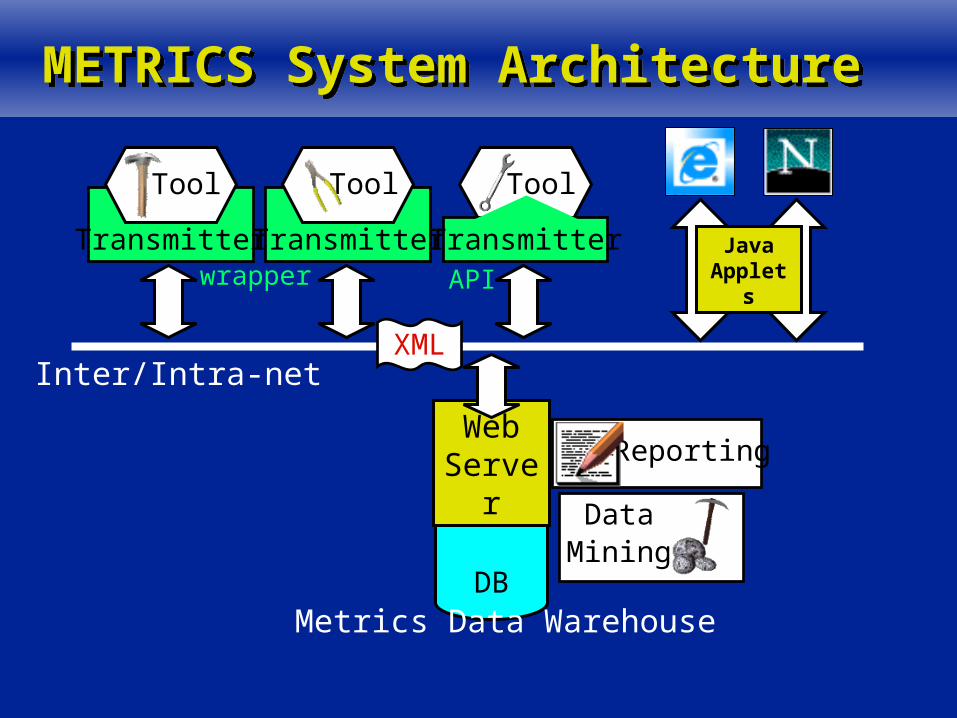
METRICS System ArchitectureMETRICS System Architecture
Inter/Intra-net
DBMetrics Data Warehouse
WebServer
JavaApplets
DataMining
Reporting
Transmitter Transmitterwrapper
Tool Tool Tool
TransmitterAPI
XML
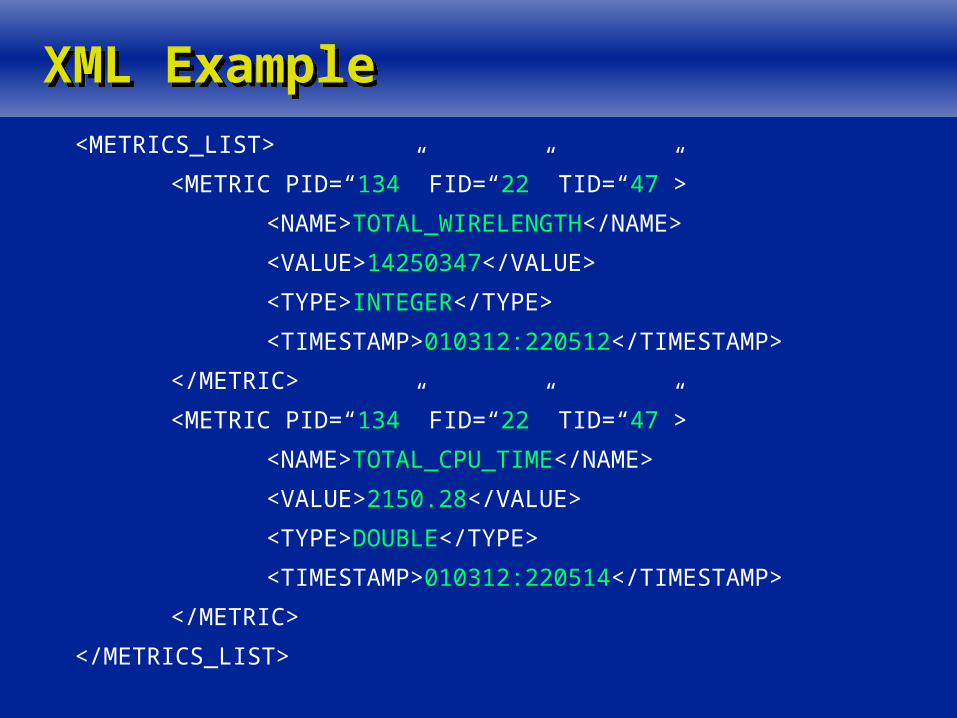
XML ExampleXML Example<METRICS_LIST>
<METRIC PID=“134” FID=“22” TID=“47”>
<NAME>TOTAL_WIRELENGTH</NAME>
<VALUE>14250347</VALUE>
<TYPE>INTEGER</TYPE>
<TIMESTAMP>010312:220512</TIMESTAMP>
</METRIC>
<METRIC PID=“134” FID=“22” TID=“47”>
<NAME>TOTAL_CPU_TIME</NAME>
<VALUE>2150.28</VALUE>
<TYPE>DOUBLE</TYPE>
<TIMESTAMP>010312:220514</TIMESTAMP>
</METRIC>
</METRICS_LIST>
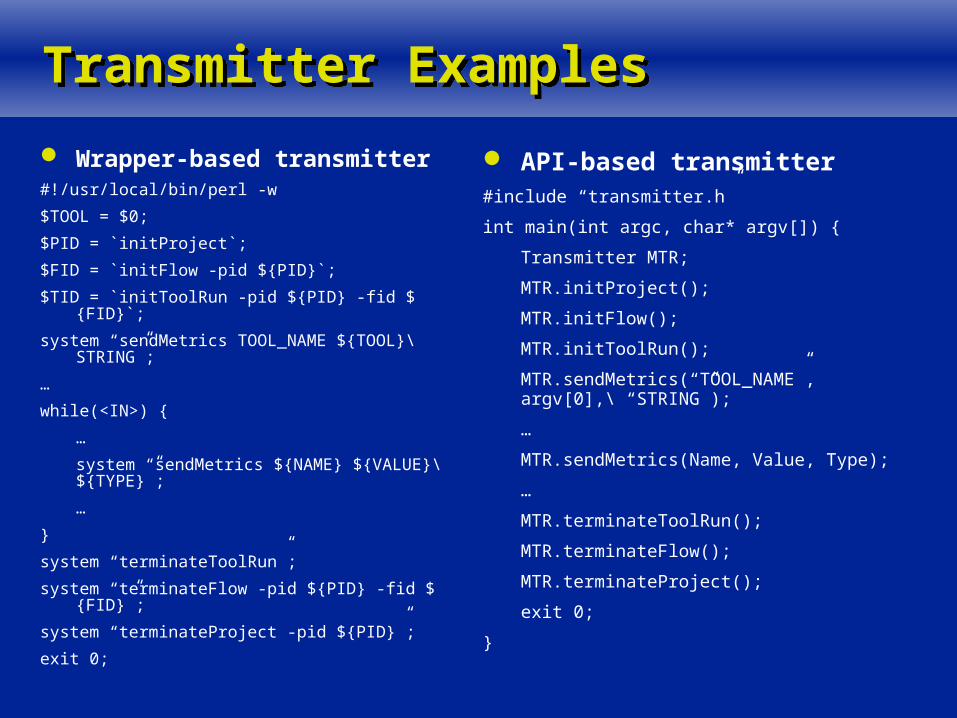
Transmitter ExamplesTransmitter Examples
Wrapper-based transmitter#!/usr/local/bin/perl -w
$TOOL = $0;
$PID = `initProject`;
$FID = `initFlow -pid ${PID}`;
$TID = `initToolRun -pid ${PID} -fid ${FID}`;
system “sendMetrics TOOL_NAME ${TOOL}\ STRING”;
…
while(<IN>) {
…
system “sendMetrics ${NAME} ${VALUE}\ ${TYPE}”;
…
}
system “terminateToolRun”;
system “terminateFlow -pid ${PID} -fid ${FID}”;
system “terminateProject -pid ${PID}”;
exit 0;
API-based transmitter#include “transmitter.h”
int main(int argc, char* argv[]) {
Transmitter MTR;
MTR.initProject();
MTR.initFlow();
MTR.initToolRun();
MTR.sendMetrics(“TOOL_NAME”, argv[0],\ “STRING”);
…
MTR.sendMetrics(Name, Value, Type);
…
MTR.terminateToolRun();
MTR.terminateFlow();
MTR.terminateProject();
exit 0;
}
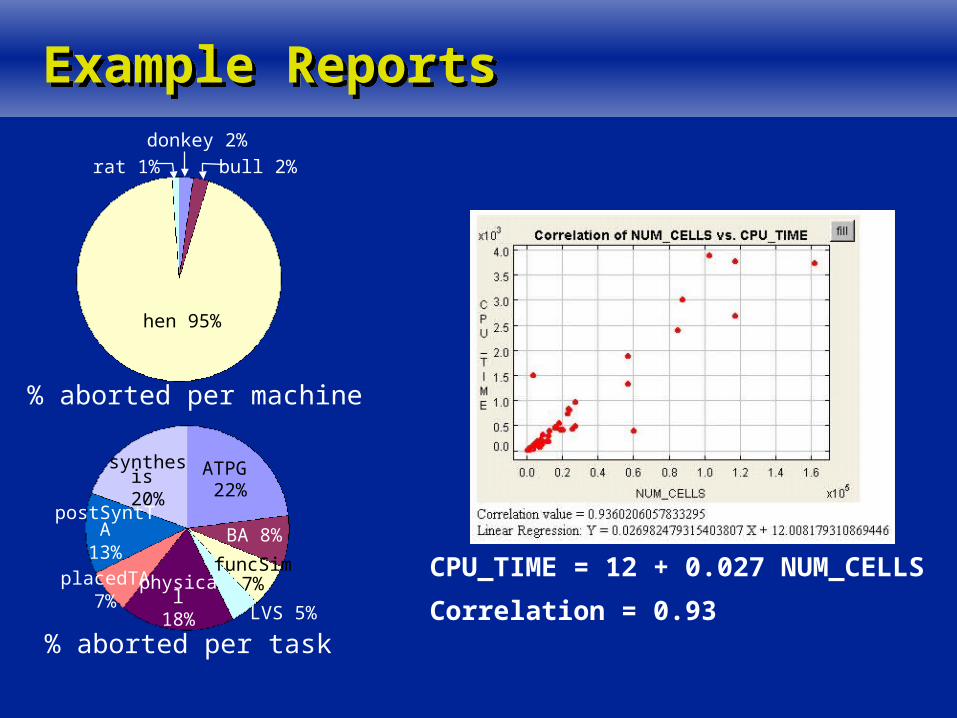
Example ReportsExample Reports
hen 95%
rat 1% bull 2%
donkey 2%
% aborted per machine
% aborted per task
BA 8%
ATPG 22%
synthesis 20%
physical18%
postSyntTA13%
placedTA7%
funcSim7%
LVS 5%
CPU_TIME = 12 + 0.027 NUM_CELLS
Correlation = 0.93
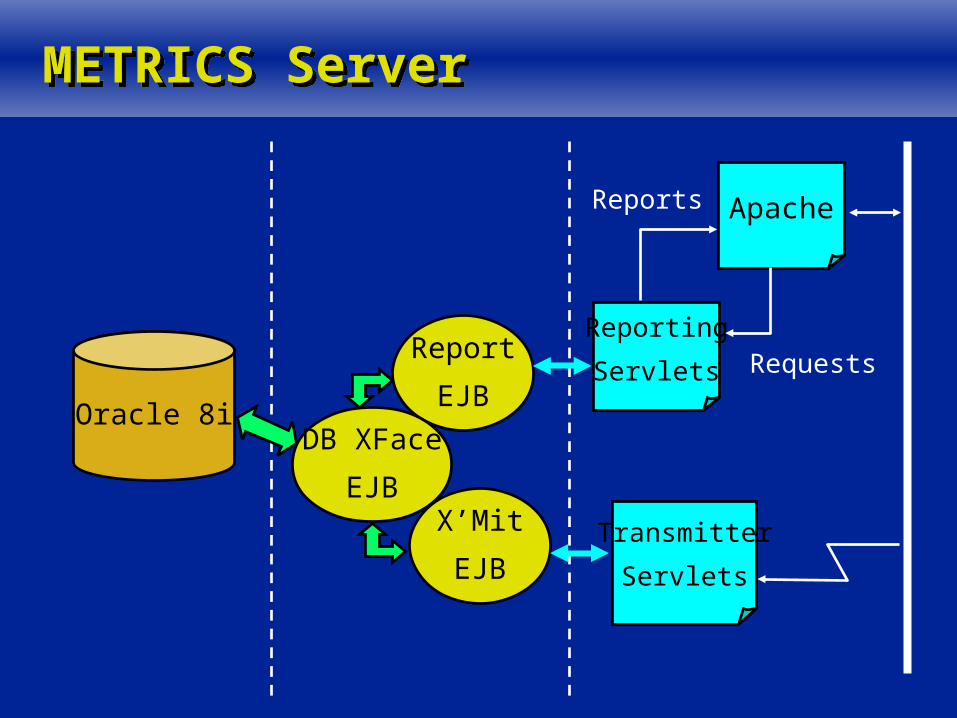
METRICS ServerMETRICS Server
Oracle 8i
Transmitter
Servlets
Reporting
Servlets
Apache
Requests
Reports
Report
EJB
DB XFace
EJBX’Mit
EJB
Open Source ArchitectureOpen Source Architecture
METRICS components are industry standards e.g., Oracle 8i, Java servlets, XML, Apache web server,
PERL/TCL scripts, etc.
Custom generated codes for wrappers and APIs are publicly available collaboration in development of wrappers and APIs porting to different operating systems
Codes are available at: http://vlsicad.cs.ucla.edu/GSRC/METRICS
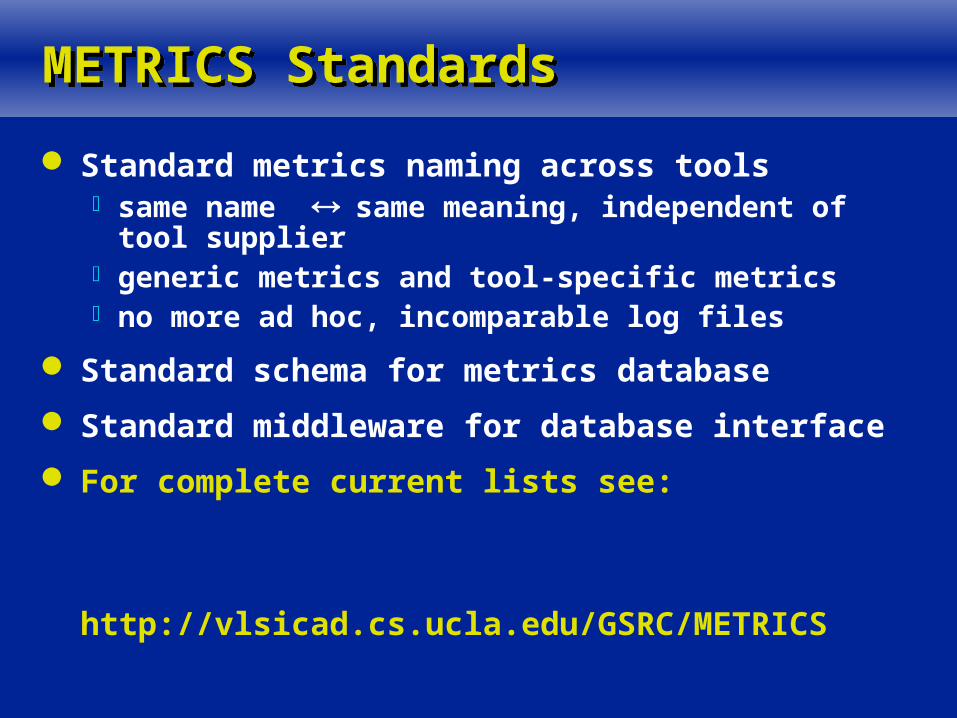
METRICS StandardsMETRICS Standards
Standard metrics naming across tools same name same meaning, independent of tool
supplier generic metrics and tool-specific metrics no more ad hoc, incomparable log files
Standard schema for metrics database
Standard middleware for database interface
For complete current lists see:
http://vlsicad.cs.ucla.edu/GSRC/METRICS
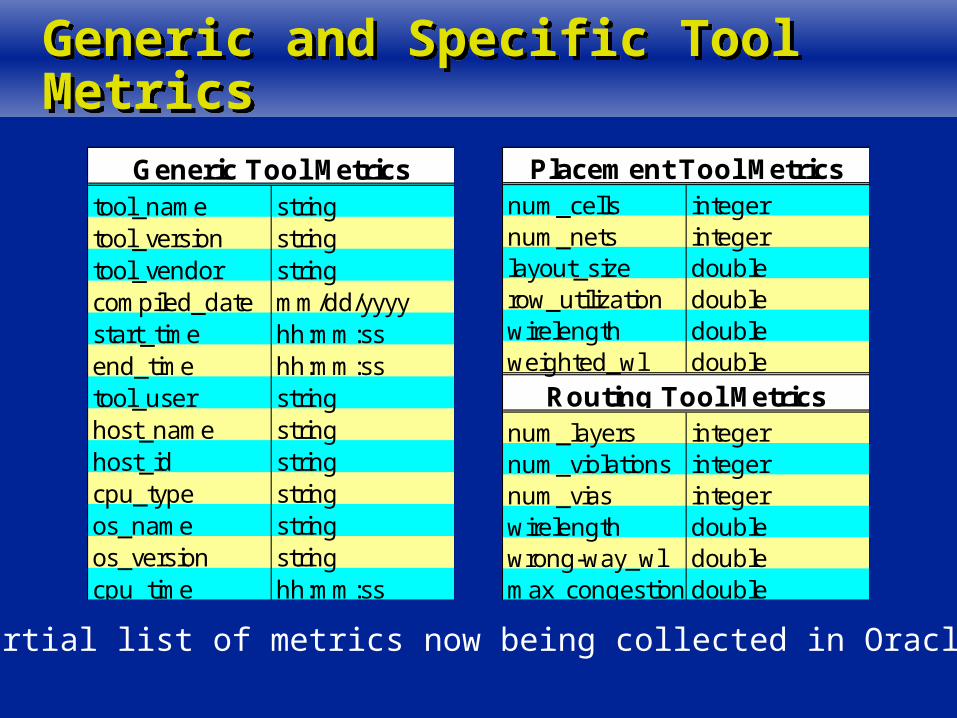
Generic and Specific Tool MetricsGeneric and Specific Tool Metrics
tool_name stringtool_version stringtool_vendor stringcompiled_date mm/dd/yyyystart_time hh:mm:ssend_time hh:mm:sstool_user stringhost_name stringhost_id stringcpu_type stringos_name stringos_version stringcpu_time hh:mm:ss
Generic Tool Metricsnum_cells integernum_nets integerlayout_size doublerow_utilization doublewirelength doubleweighted_wl double
num_layers integernum_violations integernum_vias integerwirelength doublewrong-way_wl doublemax_congestion double
Placement Tool Metrics
Routing Tool Metrics
Partial list of metrics now being collected in Oracle8i
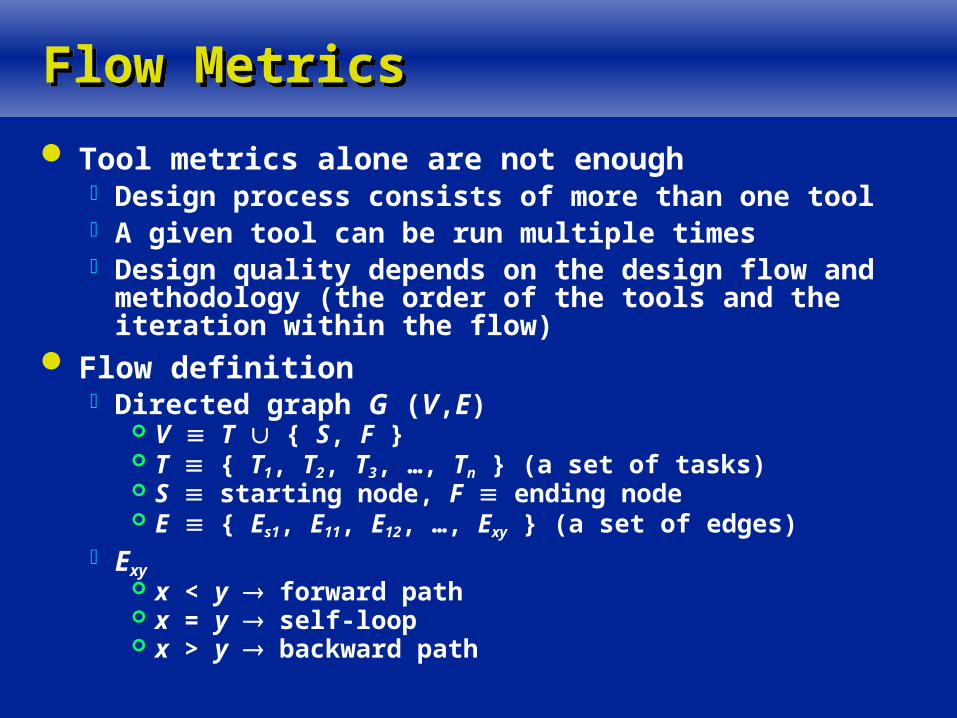
Flow MetricsFlow Metrics
Tool metrics alone are not enough Design process consists of more than one tool A given tool can be run multiple times Design quality depends on the design flow and
methodology (the order of the tools and the iteration within the flow)
Flow definition Directed graph G (V,E)
V T { S, F } T { T1, T2, T3, …, Tn } (a set of tasks) S starting node, F ending node E { Es1, E11, E12, …, Exy } (a set of edges)
Exy x < y forward path x = y self-loop x > y backward path
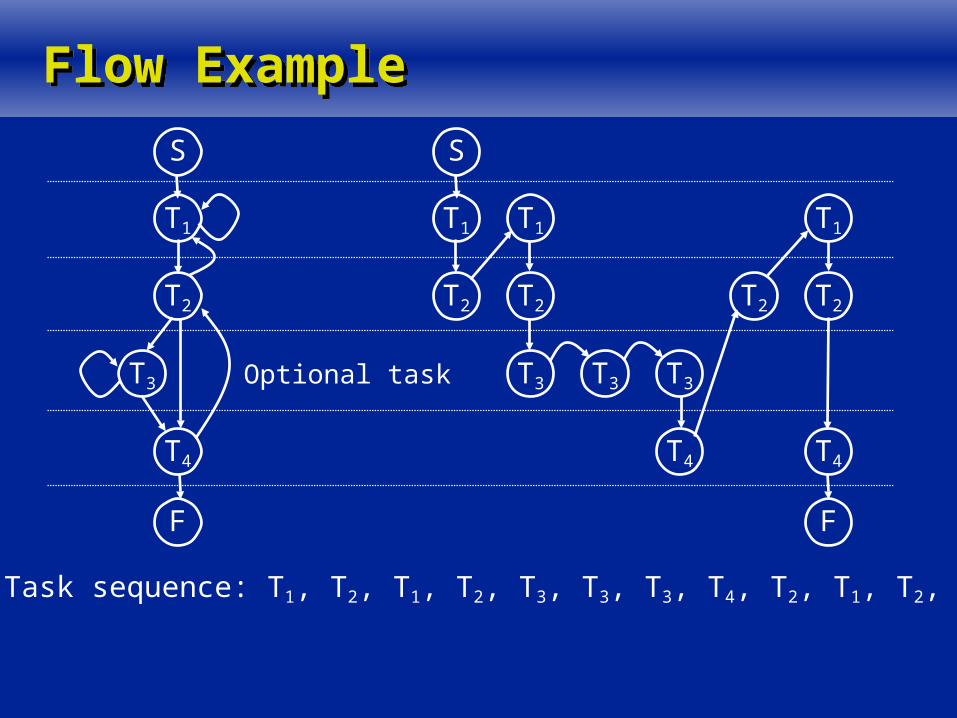
Flow ExampleFlow Example
S
T1
T2
T3
T4
F
Optional task
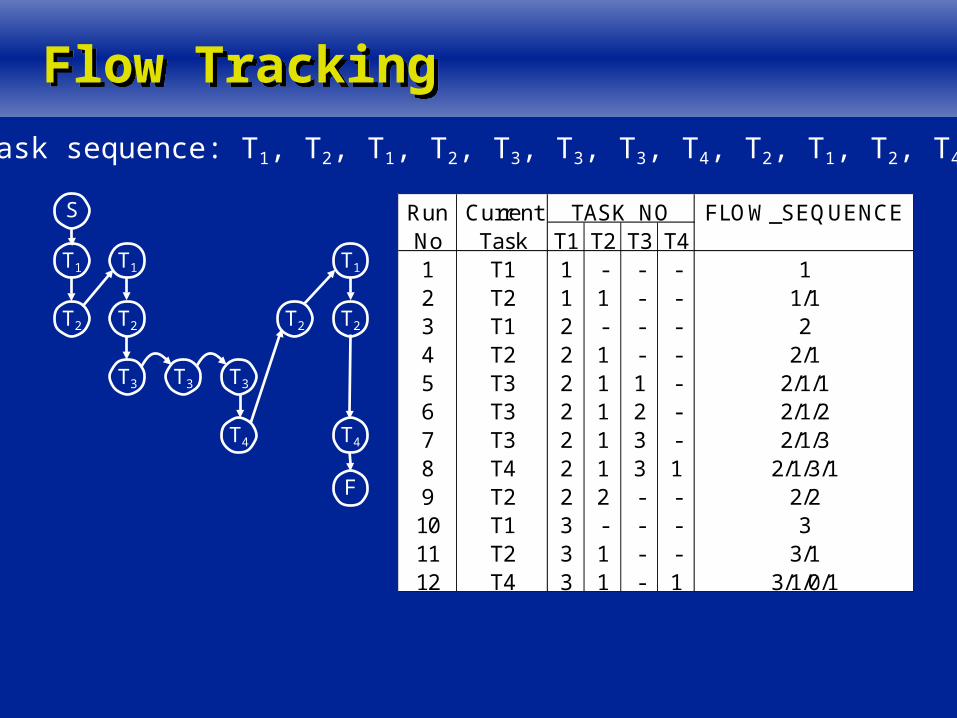
Task sequence: T1, T2, T1, T2, T3, T3, T3, T4, T2, T1, T2, T4
S
T1
T2
F
T1
T2
T3 T3 T3
T4
T2
T1
T2
T4
Flow TrackingFlow Tracking
Run Current FLOW_SEQUENCENo Task T1 T2 T3 T41 T1 1 - - - 12 T2 1 1 - - 1/13 T1 2 - - - 24 T2 2 1 - - 2/15 T3 2 1 1 - 2/1/16 T3 2 1 2 - 2/1/27 T3 2 1 3 - 2/1/38 T4 2 1 3 1 2/1/3/19 T2 2 2 - - 2/210 T1 3 - - - 311 T2 3 1 - - 3/112 T4 3 1 - 1 3/1/0/1
TASK_NOS
T1
T2
F
T1
T2
T3 T3 T3
T4
T2
T1
T2
T4
Task sequence: T1, T2, T1, T2, T3, T3, T3, T4, T2, T1, T2, T4
Chip Design Flow ExampleChip Design Flow Example
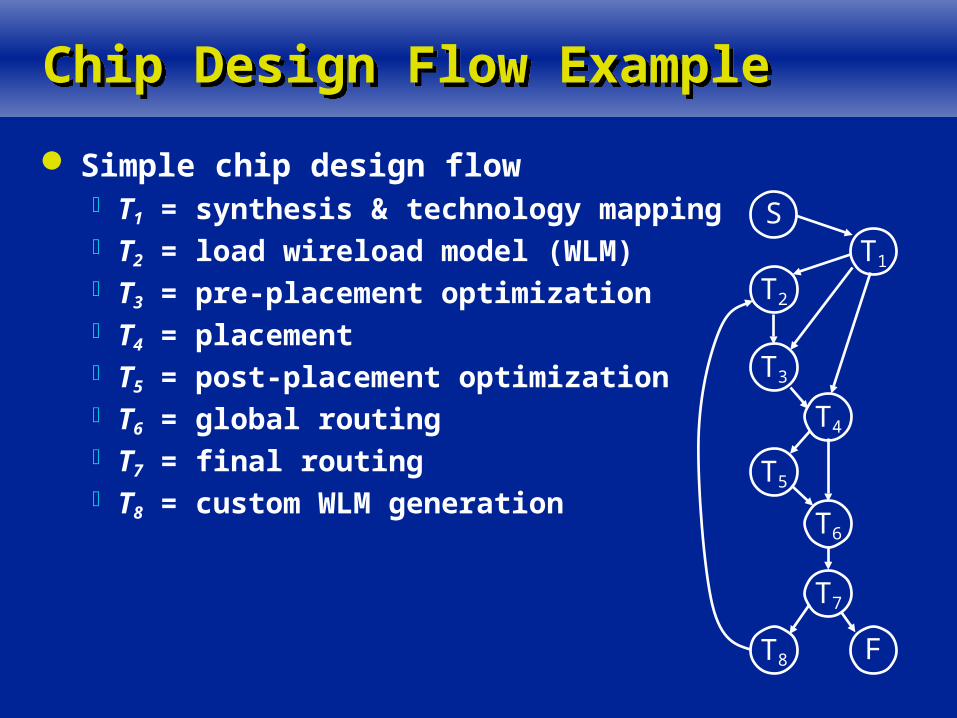
Simple chip design flow T1 = synthesis & technology mapping T2 = load wireload model (WLM) T3 = pre-placement optimization T4 = placement T5 = post-placement optimization T6 = global routing T7 = final routing T8 = custom WLM generation
ST1
T2
T3
T4
F
T5
T7
T8
T6
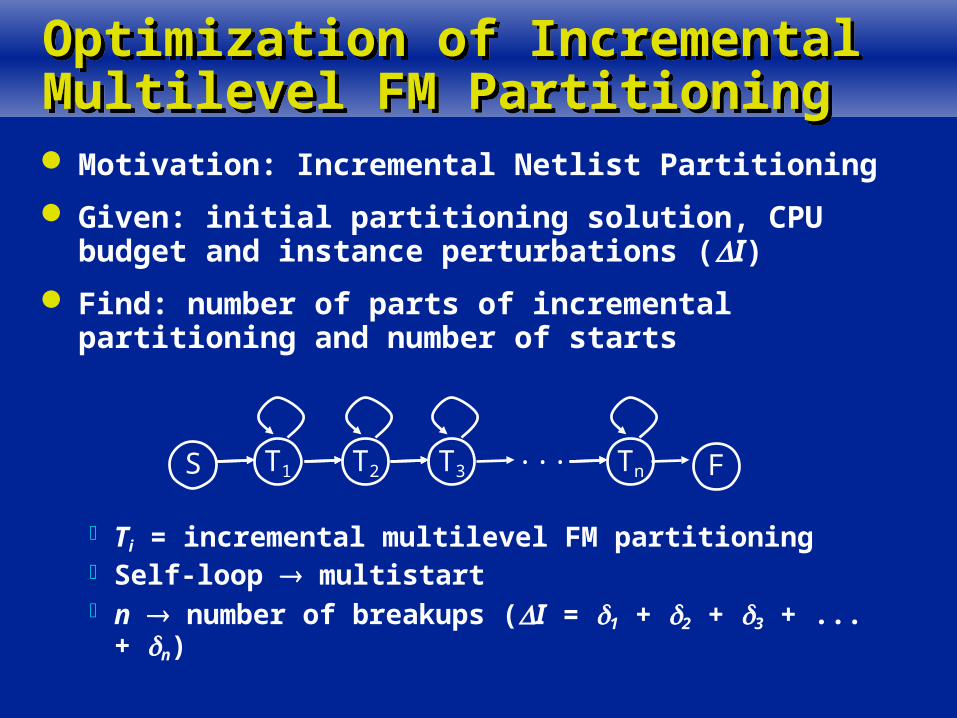
Optimization of Incremental Multilevel FM PartitioningOptimization of Incremental Multilevel FM Partitioning Motivation: Incremental Netlist Partitioning
Given: initial partitioning solution, CPU budget and instance perturbations (I)
Find: number of parts of incremental partitioning and number of starts
Ti = incremental multilevel FM partitioning Self-loop multistart n number of breakups (I = 1 + 2 + 3 + ... + n)
S T1 FT2 T3 Tn...
Flow Optimization ResultsFlow Optimization Results
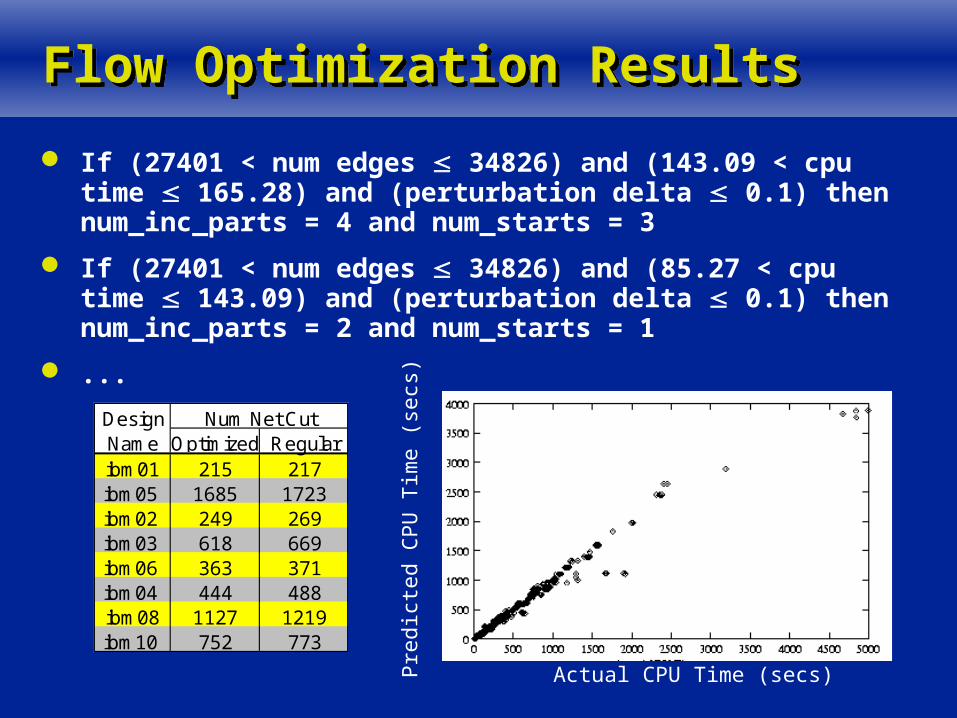
If (27401 < num edges 34826) and (143.09 < cpu time 165.28) and (perturbation delta 0.1) then num_inc_parts = 4 and num_starts = 3
If (27401 < num edges 34826) and (85.27 < cpu time 143.09) and (perturbation delta 0.1) then num_inc_parts = 2 and num_starts = 1
...
Actual CPU Time (secs)
Pre
dict
ed C
PU
Tim
e (s
ecs)
DesignName Optimized Regularibm01 215 217ibm05 1685 1723ibm02 249 269ibm03 618 669ibm06 363 371ibm04 444 488ibm08 1127 1219ibm10 752 773
Num Net Cut
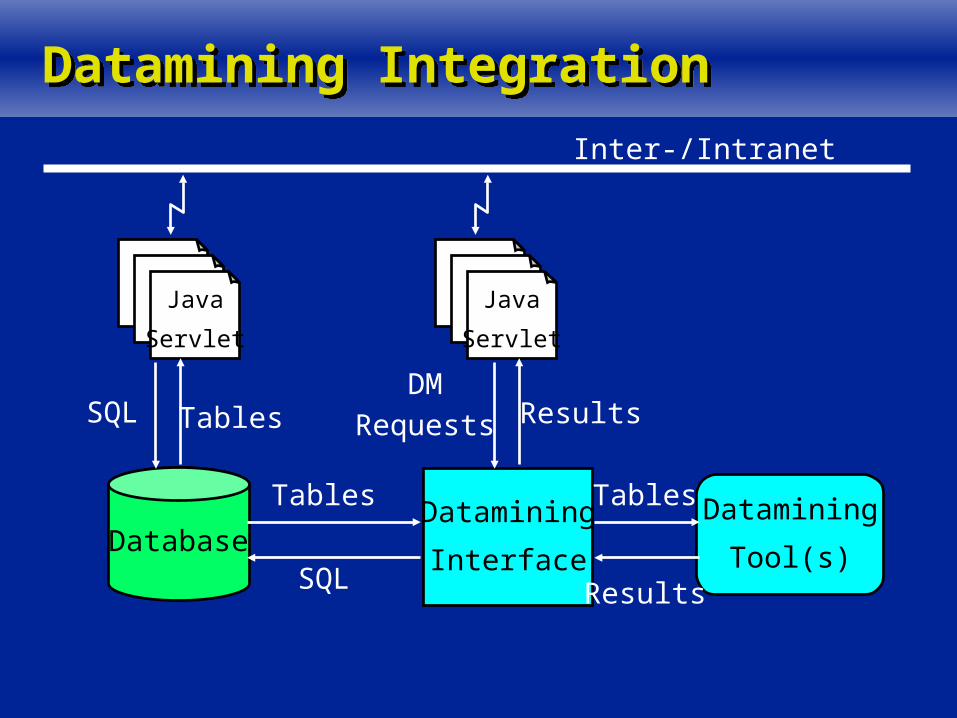
Datamining IntegrationDatamining Integration
DatabaseDatamining
Tool(s)
Datamining
Interface
Java
Servlet
Java
Servlet
SQL
SQL
Tables
Tables Tables
Results
ResultsDM
Requests
Inter-/Intranet
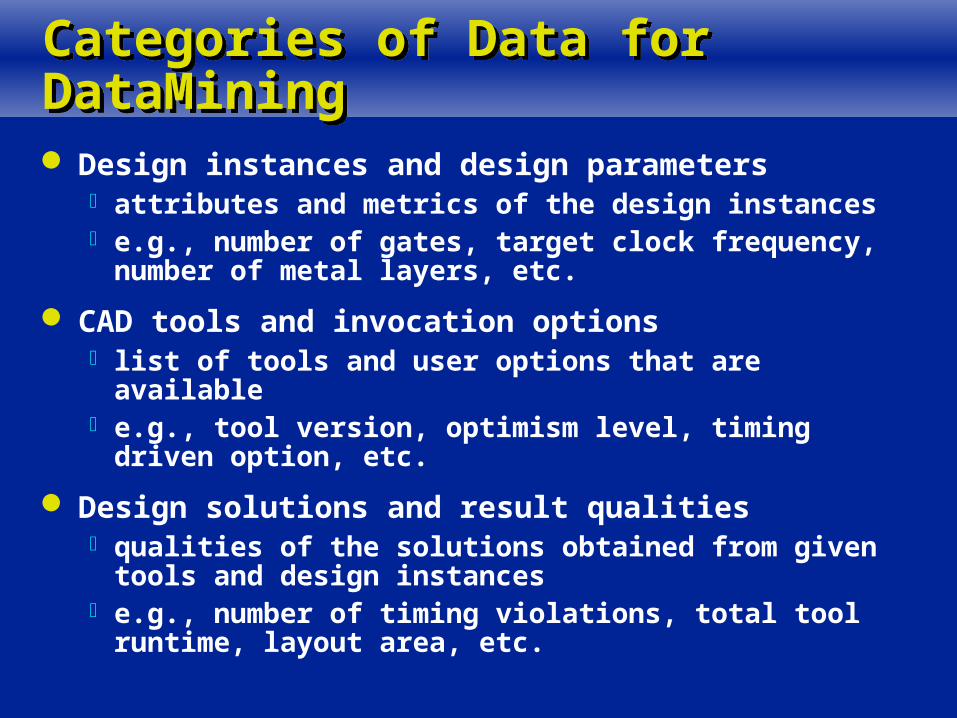
Categories of Data for DataMiningCategories of Data for DataMining
Design instances and design parameters attributes and metrics of the design instances e.g., number of gates, target clock frequency, number
of metal layers, etc.
CAD tools and invocation options list of tools and user options that are available e.g., tool version, optimism level, timing driven option,
etc.
Design solutions and result qualities qualities of the solutions obtained from given tools and
design instances e.g., number of timing violations, total tool runtime,
layout area, etc.
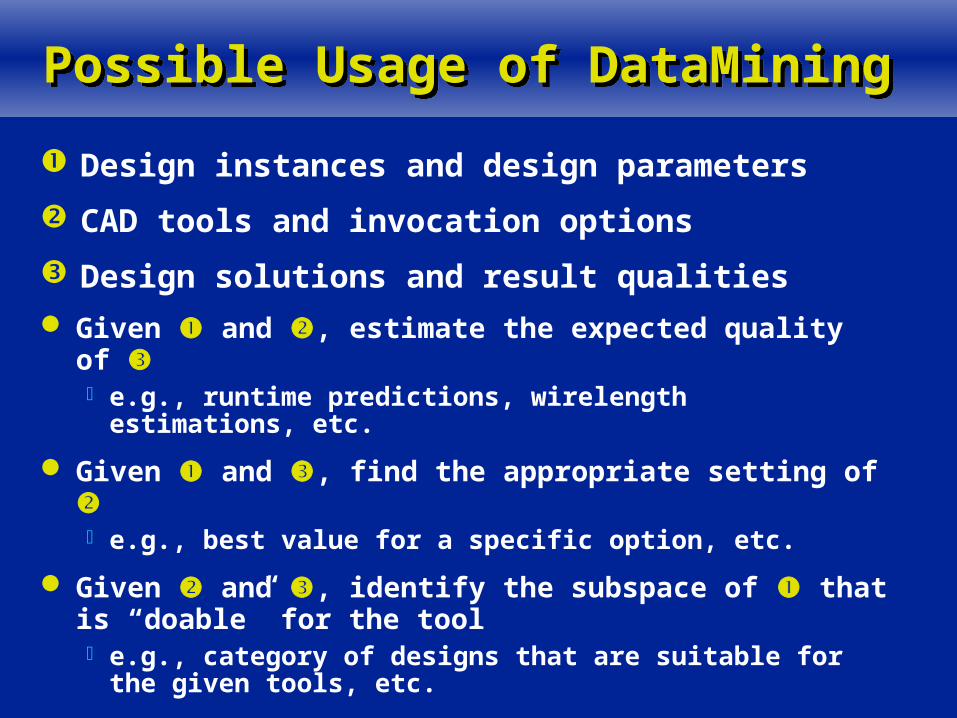
Possible Usage of DataMiningPossible Usage of DataMining
Design instances and design parameters
CAD tools and invocation options
Design solutions and result qualities
Given and , estimate the expected quality of e.g., runtime predictions, wirelength estimations, etc.
Given and , find the appropriate setting of e.g., best value for a specific option, etc.
Given and , identify the subspace of that is “doable” for the tool e.g., category of designs that are suitable for the given
tools, etc.
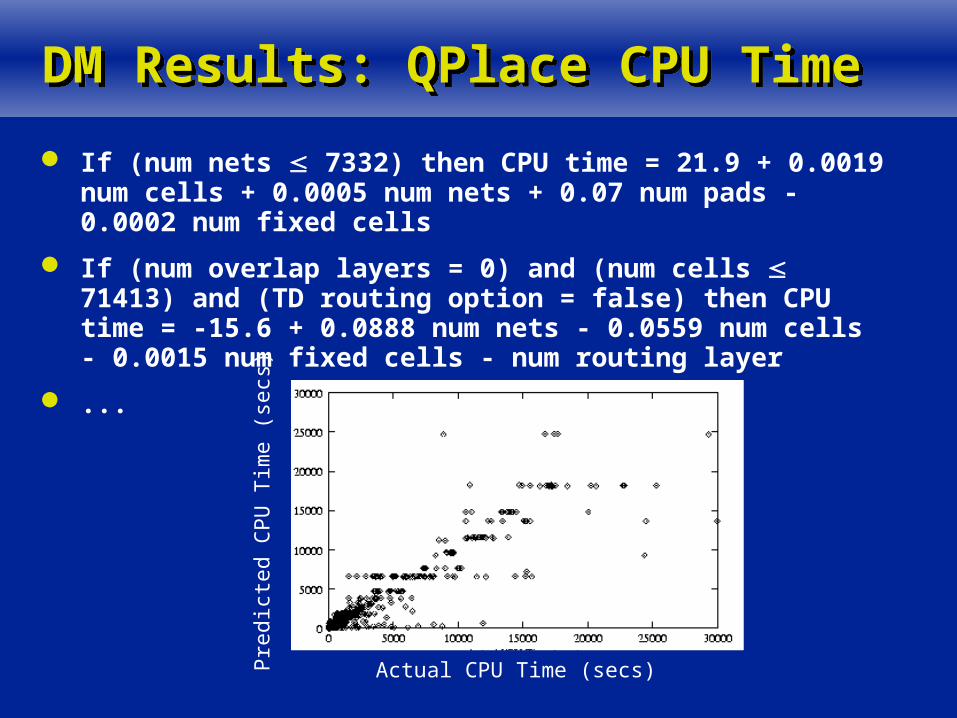
DM Results: QPlace CPU TimeDM Results: QPlace CPU Time
If (num nets 7332) then CPU time = 21.9 + 0.0019 num cells + 0.0005 num nets + 0.07 num pads - 0.0002 num fixed cells
If (num overlap layers = 0) and (num cells 71413) and (TD routing option = false) then CPU time = -15.6 + 0.0888 num nets - 0.0559 num cells - 0.0015 num fixed cells - num routing layer
...
Actual CPU Time (secs)
Pre
dict
ed C
PU
Tim
e (s
ecs)
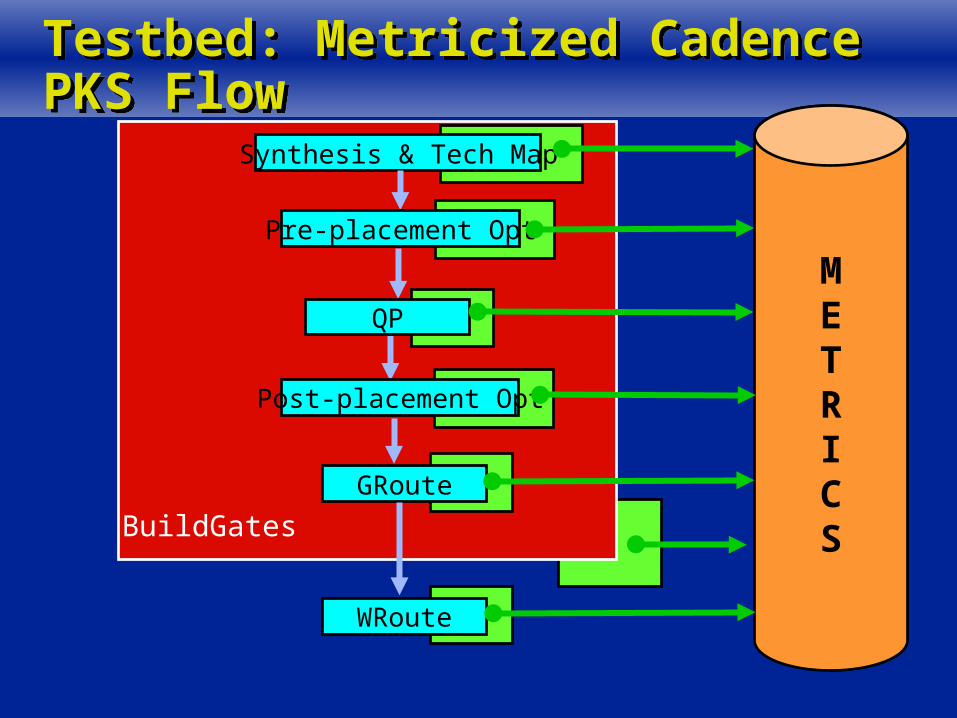
Testbed: Metricized Cadence PKS FlowTestbed: Metricized Cadence PKS Flow
Synthesis & Tech Map
METRICS
Pre-placement Opt
GRoute
QP
Post-placement Opt
WRoute
BuildGates
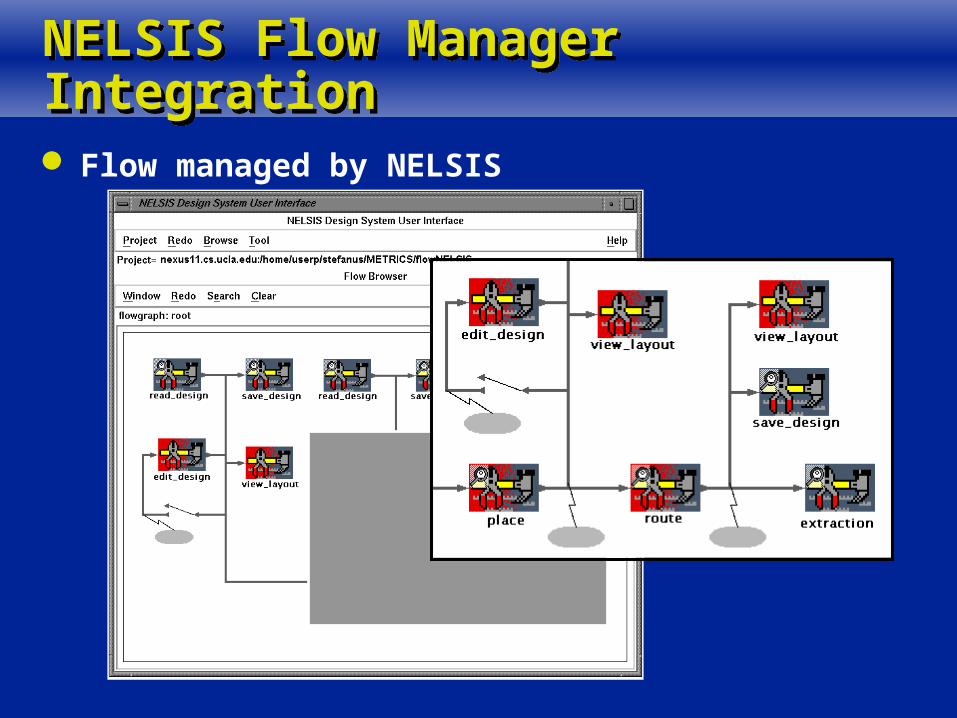
NELSIS Flow Manager IntegrationNELSIS Flow Manager Integration
Flow managed by NELSIS
IssuesIssues
Tool interface: each tool has unique interface
Security: proprietary and confidential information
Standardization: flow, terminology, data management, etc.
Cost of metrics collection: how many data are too many?
Other non-EDA tools: LSF, License Manager, etc.
Social: “big brother”, collection of social metrics, etc.
Bug detection: report the configuration that trigger the bugs, etc.
ConclusionsConclusions
Metrics collection should be automatic and transparent
API-based transmitter is the “best” approach
Ongoing work with EDA, designer communities to identify tool metrics of interest users: metrics needed for design process insight,
optimization vendors: implementation of the metrics requested,
with standardized naming / semantics


